Now trading at a price of $13.15, Key has moved 1.6% so far today.
Key returned losses of -23.0% last year, with its stock price reaching a high of $20.3 and a low of $8.54. Over the same period, the stock underperformed the S&P 500 index by -40.0%. As of April 2023, the company's 50-day average price was $11.05. KeyCorp operates as the holding company for KeyBank National Association that provides various retail and commercial banking products and services in the United States. Based in Cleveland, OH, the large-cap Finance company has 17,880 full time employees. Key has offered a 6.3% dividend yield over the last 12 months.
Increasing Revenues but Narrowing Margins:
| 2018 | 2019 | 2020 | 2021 | 2022 | 2023 | |
|---|---|---|---|---|---|---|
| Revenue (MM) | $4,878 | $5,235 | $4,685 | $4,367 | $5,412 | $7,572 |
| Revenue Growth | n/a | 7.32% | -10.51% | -6.79% | 23.93% | 39.91% |
| Interest Income (MM) | $3,909 | $3,909 | $4,034 | $4,071 | $4,527 | $4,212 |
| Operating Margins | 46% | 39% | 34% | 75% | 43% | 31% |
| Net Margins | 38% | 33% | 28% | 60% | 35% | 17% |
| Net Income (MM) | $1,866 | $1,717 | $1,343 | $2,625 | $1,917 | $1,296 |
| Depreciation & Amort. (MM) | $382 | $241 | $111 | $58 | $137 | $143 |
| Earnings Per Share | $1.71 | $1.62 | $1.27 | $2.63 | $1.93 | $1.25 |
| EPS Growth | n/a | -5.26% | -21.6% | 107.09% | -26.62% | -35.23% |
| Diluted Shares (MM) | 1,055 | 1,002 | 975 | 957 | 933 | 931 |
| Free Cash Flow (MM) | $2,407 | $2,821 | $1,610 | $1,087 | $4,373 | $3,317 |
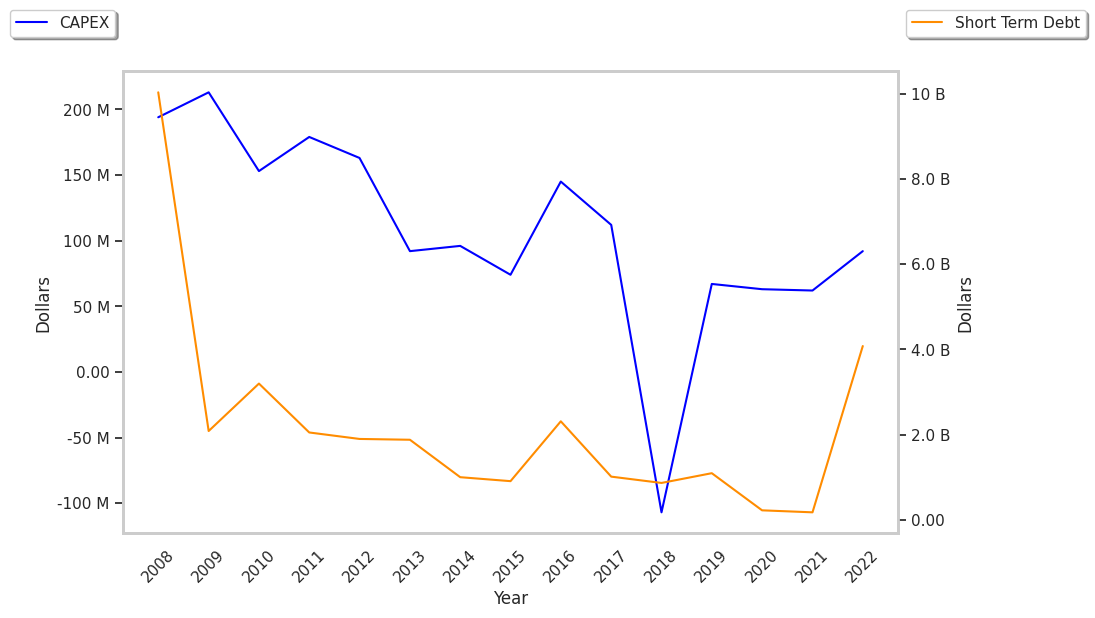
| Capital Expenditures (MM) | $99 | $85 | $63 | $66 | $96 | $134 |
| Current Ratio | 40.56 | 23.08 | 22.54 | 3.53 | 1.1 | 1.01 |
| Long Term Debt (MM) | $13,732 | $12,448 | $13,709 | $12,042 | $19,307 | $21,303 |
Key has growing revenues and increasing reinvestment in the business, low debt levels, and decent net margins with a negative growth trend. However, the firm has declining EPS growth. Finally, we note that Key has irregular cash flows.
The Market May Be Undervaluing Key's Assets and Equity:
Key has a trailing twelve month P/E ratio of 9.0, compared to an average of 12.38 for the Finance sector. Based on its EPS guidance of $1.29, the company has a forward P/E ratio of 8.6. The company doesn't issue forward earnings guidance, and the compound average growth rate of its last 6 years of reported EPS is -5.1%. On this basis, the company's PEG ratio is -1.77, which indicates that its shares are overpriced. In contrast, the market is likely undervaluing Key in terms of its equity because its P/B ratio is 1.13 while the sector average is 1.58. The company's shares are currently trading -34.2% below their Graham number.
Key Has an Average Rating of Buy:
The 19 analysts following Key have set target prices ranging from $10.0 to $16.0 per share, for an average of $12.76 with a buy rating. As of April 2023, the company is trading -13.4% away from its average target price, indicating that there is an analyst consensus of little upside potential.
Key has an average amount of shares sold short because 4.9% of the company's shares are sold short. Institutions own 82.6% of the company's shares, and the insider ownership rate stands at 0.33%, suggesting a small amount of insider investors. The largest shareholder is Vanguard Group Inc, whose 12% stake in the company is worth $1,445,084,400.