One of today's standouts was Block, a software company whose shares are up 4.8%, outperforming the Nasdaq by 6.0%. At $68.0, the stock is not far from its average analyst target price of $71.51.
The average analyst rating for the stock is buy. SQ may have outstripped the S&P 500 index by 5.0% today, but it has lagged behind the index by -6.0% over the last year, returning 11.0%.
Block, Inc., together with its subsidiaries, creates tools that enables sellers to accept card payments and provides reporting and analytics, and next-day settlement. The company is a technology company. Valuations in the technology sector are often very high, as investors are willing to overlook gaps in the fundamentals if they believe a company’s innovations can dominate or create new markets.
Block does not release its trailing 12 month P/E ratio since its earnings per share of $-0.46 were negative over the last year. But we can calculate it ourselves, which gives us a trailing P/E ratio for SQ of -147.8. Based on the company's positive earnings guidance of $3.07, the stock has a forward P/E ratio of 22.1. As of the first quarter of 2023, the average Price to Earnings (P/E) ratio of US technology companies is 35.0, and the S&P 500 average is 15.97. The P/E ratio consists in the stock's share price divided by its earnings per share (EPS), representing how much investors are willing to spend for each dollar of the company's earnings. Earnings are the company's revenues minus the cost of goods sold, overhead, and taxes.
Block's P/E ratio tells us how much investors are willing to pay for each dollar of the company's earnings. The problem with this metric is that it doesn't take into account the expected growth in earnings of the stock. Sometimes elevated P/E ratios can be justified by equally elevated growth expectations.
We can solve this inconsistency by dividing the company's trailing P/E ratio by its five year earnings growth estimate, which in this case gives us a 0.49 Price to Earnings Growth (PEG) ratio. In SQ's case, the elevated P/E ratio is justified by future earnings growth estimates -- assuming those estimates turn out to be close to reality.
An analysis of the company's gross profit margins can help us understand its long term profitability and market position. Gross profits are the company's revenue minus the cost of goods only, and unlike earnings, don't take into account taxes and overhead. Here's an overview of Block's gross profit margin trends:
| Date Reported | Revenue ($ k) | Cost of Revenue ($ k) | Gross Margins (%) | YoY Growth (%) |
|---|---|---|---|---|
| 2023 | 20,793,483 | 13,654,154 | 34 | 0.0 |
| 2022 | 17,531,587 | 11,539,695 | 34 | 36.0 |
| 2021 | 17,661,203 | 13,241,380 | 25 | -10.71 |
| 2020 | 9,497,578 | 6,764,169 | 28 | -30.0 |
| 2019 | 4,713,500 | 2,823,815 | 40 | 0.0 |
| 2018 | 3,298,177 | 1,994,477 | 40 |
- Average gross margin: 33.5 %
- Average gross margin growth rate: -2.5 %
- Coefficient of variability (lower numbers indicating more stability): 71.7 %
We can see from the above that Block business is not strong and its stock is likely not suitable for conservative investors.
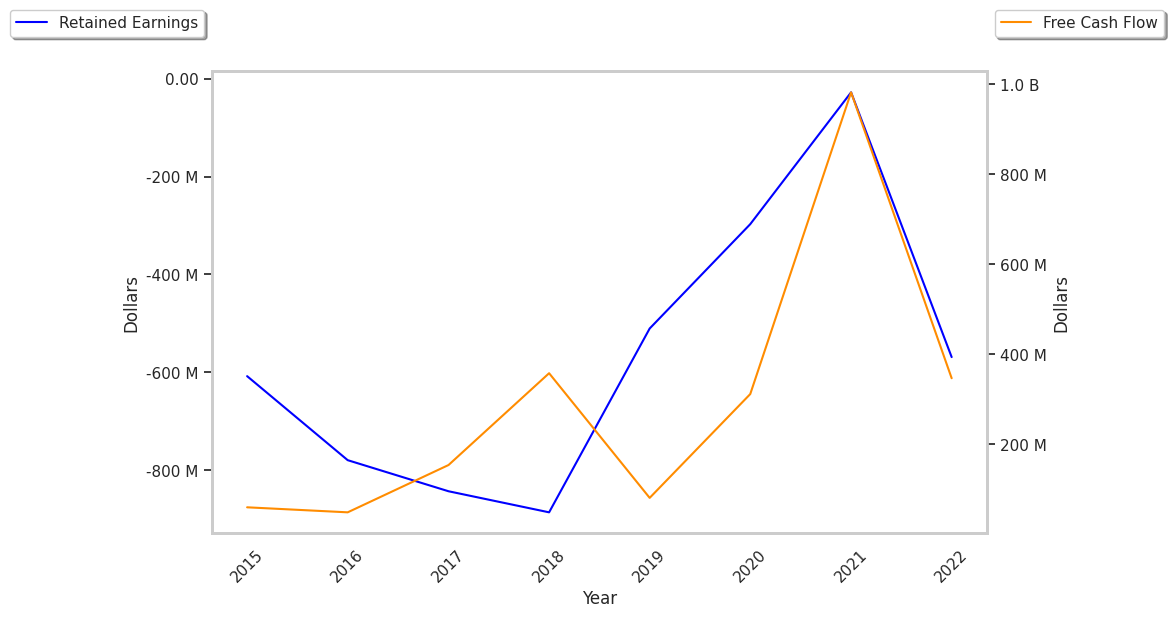
Block's financial viability can also be assessed through a review of its free cash flow trends. Free cash flow refers to its operating cash flows minues its capital expenditures, which are expenses related to the maintenance of fixed assets such as land, infrastructure, and equipment. Over the last four years, the trends have been as follows:
| Date Reported | Cash Flow from Operations ($ k) | Capital expenditures ($ k) | Free Cash Flow ($ k) | YoY Growth (%) |
|---|---|---|---|---|
| 2023 | 944,253 | 148,563 | 795,690 | 15538.56 |
| 2022 | 175,903 | 170,815 | 5,088 | -99.29 |
| 2021 | 847,830 | 134,320 | 713,510 | 1955.75 |
| 2020 | 173,110 | 138,402 | 34,708 | -86.91 |
| 2019 | 327,630 | 62,498 | 265,132 | 13.36 |
| 2018 | 295,080 | 61,203 | 233,877 |
- Average free cash flow: $341.33 Million
- Average free cash flow growth rate: 22.6 %
- Coefficient of variability (lower numbers indicating more stability): 235.8 %
Free cash flows represents the amount of money that is available for reinvesting in the business, or paying out to investors in the form of a dividend. With a positive cash flow as of the last fiscal year, SQ is in a position to do either -- which can encourage more investors to place their capital in the company.
Another valuation metric for analyzing a stock is its Price to Book (P/B) Ratio, which consists in its share price divided by its book value per share. The book value refers to the present liquidation value of the company, as if it sold all of its assets and paid off all debts. As of the first quarter of 2023, the average P/B ratio for technology companies is 7.92. In contrast, the average P/B ratio of the S&P 500 is 2.95. Block's P/B ratio is 2.34, indicating that the market value of the company exceeds its book value by a factor of more than2, but is still below the average P/B ratio of the Technology sector.
As of first quarter of 2023, Block is likely overvalued because it has a negative P/E ratio, a lower P/B ratio than its sector average, and irregular cash flows that are on an upwards course. The stock has poor growth indicators because of its weak operating margins with a stable trend, and a negative PEG ratio. We hope this analysis will inspire you to do your own research into SQ's fundamental values -- especially their trends over time.