Now trading at a price of $37.91, TC Energy has moved -0.0% so far today.
TC Energy returned losses of -9.0% last year, with its stock price reaching a high of $45.18 and a low of $32.52. Over the same period, the stock underperformed the S&P 500 index by -26.0%. As of April 2023, the company's 50-day average price was $35.47. TC Energy Corporation operates as an energy infrastructure company in North America. Based in Calgary, Canada, the large-cap Utilities company has 7,477 full time employees. TC Energy has returned a 10.2% dividend yield over the last 12 months, but the company's patchy cash flow history may not sustain it for much longer.
The Company's Revenues Are Declining:
| 2018 | 2019 | 2020 | 2021 | 2022 | 2023 | |
|---|---|---|---|---|---|---|
| Revenue (MM) | $13,679 | $13,255 | $12,999 | $13,387 | $14,977 | $14,977 |
| Revenue Growth | n/a | -3.1% | -1.93% | 2.98% | 11.88% | 0.0% |
| Gross Margins | 36% | 44% | 45% | 23% | 38% | 38% |
| Operating Margins | 42% | 50% | 52% | 30% | 24% | 24% |
| Net Margins | 27% | 33% | 38% | 15% | 5% | 5% |
| Net Income (MM) | $3,702 | $4,433 | $4,913 | $2,046 | $785 | $785 |
| Net Interest Expense (MM) | $2,265 | $2,333 | $2,228 | $2,360 | $2,588 | $2,588 |
| Depreciation & Amort. (MM) | $2,350 | $2,464 | $2,590 | $2,522 | $2,584 | $2,584 |
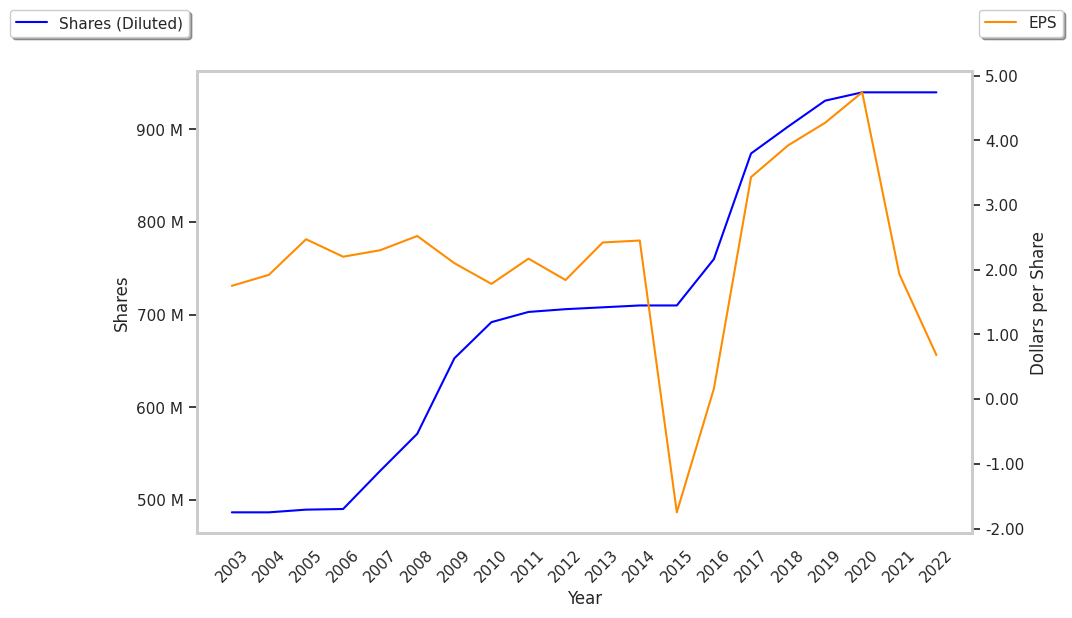
| Earnings Per Share | $3.92 | $4.27 | $4.74 | $1.86 | $0.64 | $0.64 |
| Diluted Shares (MM) | 903 | 931 | 940 | 974 | 996 | 996 |
| Free Cash Flow (MM) | -$4,374 | -$1,702 | -$1,842 | -$244 | -$2,586 | -$2,586 |
| Capital Expenditures (MM) | $10,929 | $8,784 | $8,900 | $7,134 | $8,961 | $8,961 |
| Current Ratio | 0.4 | 0.59 | 0.43 | 0.57 | 0.43 | 0.43 |
| Long Term Debt (MM) | $36,509 | $36,509 | $51,652 | $55,105 | $60,020 | $60,020 |
| Net Debt / EBITDA | 4.78 | 4.35 | 6.46 | 9.89 | 9.62 | 9.62 |
TC Energy's financial statements include several red flags such as weak revenue growth and decreasing reinvestment in the business, declining EPS growth, and an unconvincing cash flow history. Additionally, the firm has a highly leveraged balance sheet. On the other hand, the company benefits from wider gross margins than its peer group and decent operating margins with a negative growth trend.
TC Energy does not have a meaningful trailing P/E ratio since its earnings per share are currently in the red. Based on its EPS guidance of $3.0, the company has a forward P/E ratio of 11.8. In comparison, the average P/E ratio for the Utilities sector is 17.53. On the other hand, the market is undervaluing TC Energy in terms of its equity because its P/B ratio is 1.26. In comparison, the sector average is 1.71.
TC Energy Has an Average Rating of Hold:
The 8 analysts following TC Energy have set target prices ranging from $29.1 to $72.25 per share, for an average of $43.14 with a hold rating. As of April 2023, the company is trading -17.8% away from its average target price, indicating that there is an analyst consensus of some upside potential.
The largest shareholder is Royal Bank of Canada, whose 9% stake in the company is worth $3,701,528,215.