Aptiv PLC logged a -0.0% change during today's evening session, and is now trading at a price of $80.85 per share.
Aptiv PLC returned losses of -13.0% last year, with its stock price reaching a high of $124.88 and a low of $71.01. Over the same period, the stock underperformed the S&P 500 index by -30.0%. As of April 2023, the company's 50-day average price was $86.77. Aptiv PLC engages in design, manufacture, and sale of vehicle components worldwide. Based in Dublin, Ireland, the large-cap Consumer Discretionary company has 22,000 full time employees. Aptiv PLC has not offered a regular dividend during the last year.
Growing Revenues With a Flat Capital Expenditure Trend:
| 2018 | 2019 | 2020 | 2021 | 2022 | 2023 | |
|---|---|---|---|---|---|---|
| Revenue (MM) | $21 | $14,357 | $13,066 | $15,618 | $17,489 | $19,772 |
| Revenue Growth | n/a | 68266.67% | -8.99% | 19.53% | 11.98% | 13.05% |
| Gross Margins | -61624% | 9% | 15% | 8% | 7% | 8% |
| Operating Margins | 7014% | 9% | 16% | 8% | 7% | 8% |
| Net Margins | 5271% | 7% | 14% | 4% | 3% | 12% |
| Net Income (MM) | $1,107 | $1,009 | $1,822 | $609 | $594 | $2,313 |
| Net Interest Expense (MM) | $141 | $164 | $164 | $150 | $219 | $276 |
| Depreciation & Amort. (MM) | $522 | $571 | $620 | $625 | $613 | $640 |
| Earnings Per Share | $4.02 | $3.85 | $6.66 | $1.94 | $1.96 | $8.0 |
| EPS Growth | n/a | -4.23% | 72.99% | -70.87% | 1.03% | 308.16% |
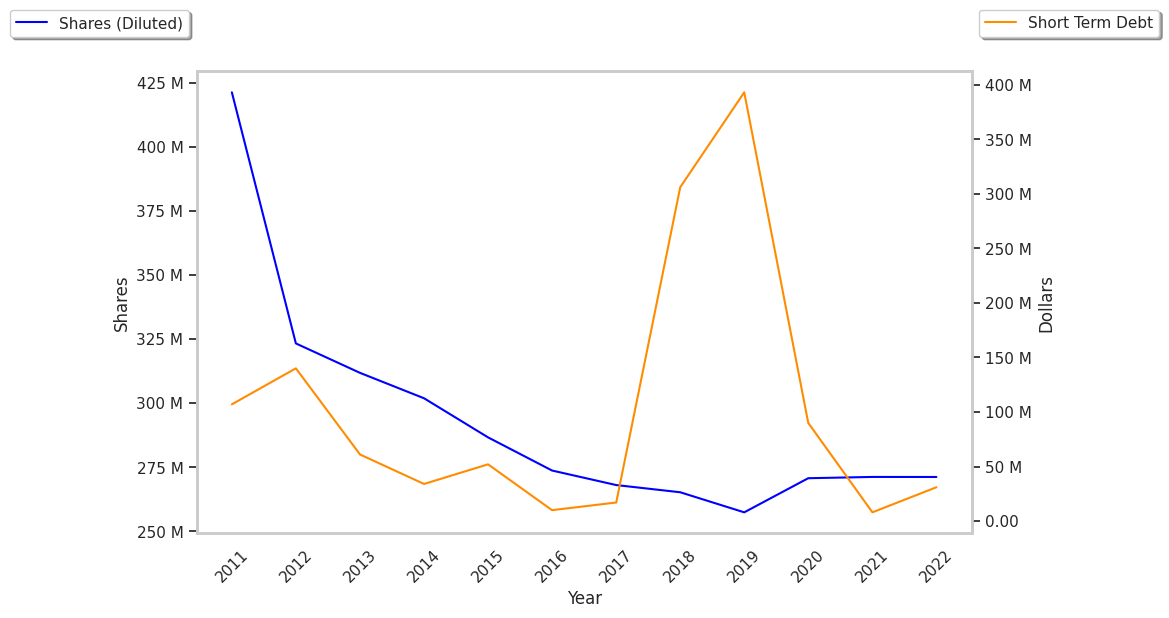
| Diluted Shares (MM) | 265 | 257 | 271 | 271 | 271 | 1,098 |
| Free Cash Flow (MM) | $794 | $843 | $829 | $611 | $419 | $1,324 |
| Capital Expenditures (MM) | $846 | $781 | $584 | $611 | $844 | $881 |
| Current Ratio | 1.29 | 1.31 | 1.85 | 2.01 | 1.6 | 1.81 |
| Long Term Debt (MM) | $4,038 | $3,971 | $4,011 | $4,059 | $6,460 | $6,419 |
| Net Debt / EBITDA | 1.89 | 2.14 | 0.47 | 0.51 | 2.64 | 2.04 |
Aptiv PLC has growing revenues and a flat capital expenditure trend and strong margins with a negative growth trend. Additionally, the company's financial statements display a strong EPS growth trend and healthy leverage. However, the firm has slimmer gross margins than its peers. Finally, we note that Aptiv PLC has irregular cash flows.
A Lower P/B Ratio Than Its Sector Average but Trades Above Its Graham Number:
Aptiv PLC has a trailing twelve month P/E ratio of 10.8, compared to an average of 22.96 for the Consumer Discretionary sector. Based on its EPS guidance of $5.91, the company has a forward P/E ratio of 14.7. The company doesn't provide forward earnings guidance, and the compound average growth rate of its last 6 years of reported EPS is 12.2%. On this basis, Aptiv PLC's PEG ratio is 0.89. Using instead the 9.0% weighted average of Aptiv PLC's earnings CAGR and the broader market's anticipated 5-year EPS growth rate, the company's PEG ratio is 1.2, which shows that its shares might be fairly priced. Additionally, the market is possibly undervaluing Aptiv PLC in terms of its equity because its P/B ratio is 2.12 whereas the sector average is 4.24. The company's shares are currently trading 92.4% above their Graham number.
Aptiv PLC Has an Analyst Consensus of Strong Upside Potential:
The 24 analysts following Aptiv PLC have set target prices ranging from $69.0 to $155.0 per share, for an average of $114.63 with a buy rating. As of April 2023, the company is trading -24.3% away from its average target price, indicating that there is an analyst consensus of strong upside potential.
Aptiv PLC has a very low short interest because 1.4% of the company's shares are sold short. Institutions own 95.4% of the company's shares, and the insider ownership rate stands at 0.42%, suggesting a small amount of insider investors. The largest shareholder is Vanguard Group Inc, whose 12% stake in the company is worth $2,536,426,556.