It's been a great overnight session for Southwest Airlines Company investors, who saw their shares rise 4.2% to a price of $29.16 per share. At these higher prices, is the company still fairly valued? If you are thinking about investing, make sure to check the company's fundamentals before making a decision.
A Lower P/B Ratio Than Its Sector Average but Trades Above Its Graham Number:
Southwest Airlines Co. operates as a passenger airline company that provide scheduled air transportation services in the United States and near-international markets. The company belongs to the Consumer Discretionary sector, which has an average price to earnings (P/E) ratio of 22.96 and an average price to book (P/B) ratio of 4.24. In contrast, Southwest Airlines Company has a trailing 12 month P/E ratio of 36.0 and a P/B ratio of 1.57.
When we divideSouthwest Airlines Company's P/E ratio by its expected five-year EPS growth rate, we obtain a PEG ratio of 0.68, which indicates that the market is undervaluing the company's projected growth (a PEG ratio of 1 indicates a fairly valued company). Your analysis of the stock shouldn't end here. Rather, a good PEG ratio should alert you that it may be worthwhile to take a closer look at the stock.
Low Leverage Levels but a Declining EPS Growth Trend:
| 2018 | 2019 | 2020 | 2021 | 2022 | 2023 | |
|---|---|---|---|---|---|---|
| Revenue (MM) | $21,965 | $22,428 | $9,048 | $15,790 | $23,814 | $25,440 |
| Revenue Growth | n/a | 2.11% | -59.66% | 74.51% | 50.82% | 6.83% |
| Gross Margins | 15% | 13% | -42% | 11% | 4% | 1% |
| Operating Margins | 15% | 13% | -42% | 11% | 4% | 2% |
| Net Margins | 11% | 11% | -34% | 6% | 2% | 5% |
| Net Income (MM) | $2,465 | $2,465 | -$3,074 | $977 | $539 | $1,288 |
| Net Interest Expense (MM) | $131 | $118 | $349 | $467 | $340 | $390 |
| Depreciation & Amort. (MM) | $1,201 | $1,219 | $1,255 | $1,272 | $1,351 | $1,474 |
| Earnings Per Share | $4.29 | $4.27 | -$5.44 | $1.61 | $0.87 | $0.8200000000000001 |
| EPS Growth | n/a | -0.47% | -227.4% | 129.6% | -45.96% | -5.75% |
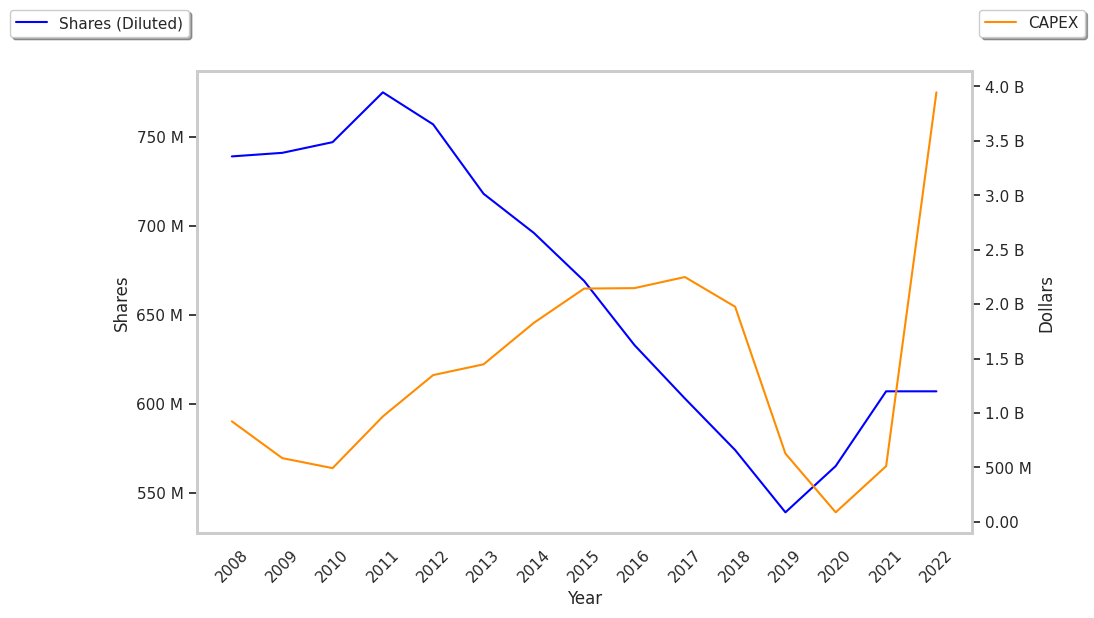
| Diluted Shares (MM) | 574 | 539 | 565 | 609 | 642 | 649 |
| Free Cash Flow (MM) | $2,971 | $2,960 | -$1,642 | $1,817 | -$134 | -$851 |
| Capital Expenditures (MM) | $1,922 | $1,027 | $515 | $505 | $3,924 | $4,168 |
| Current Ratio | 0.64 | 0.67 | 2.02 | 1.97 | 1.43 | 1.21 |
| Long Term Debt (MM) | $2,771 | $1,846 | $10,111 | $10,274 | $8,046 | $7,984 |
| Net Debt / EBITDA | 1.17 | 0.95 | 0.29 | -0.56 | -0.58 | -0.68 |
Southwest Airlines Company has slimmer gross margins than its peers, weak operating margins with a negative growth trend, and declining EPS growth. On the other hand, the company benefits from low leverage and weak revenue growth and increasing reinvestment in the business. Furthermore, Southwest Airlines Company has irregular cash flows.