Now trading at a price of $67.87, Block has moved -0.2% so far today.
Block returned gains of 7.0% last year, with its stock price reaching a high of $89.97 and a low of $38.85. Over the same period, the stock underperformed the S&P 500 index by -9.0%. As of April 2023, the company's 50-day average price was $50.08. Block, Inc., together with its subsidiaries, creates tools that enables sellers to accept card payments and provides reporting and analytics, and next-day settlement. Based in San Francisco, CA, the large-cap Technology company has 12,428 full time employees. Block has not offered a dividend during the last year.
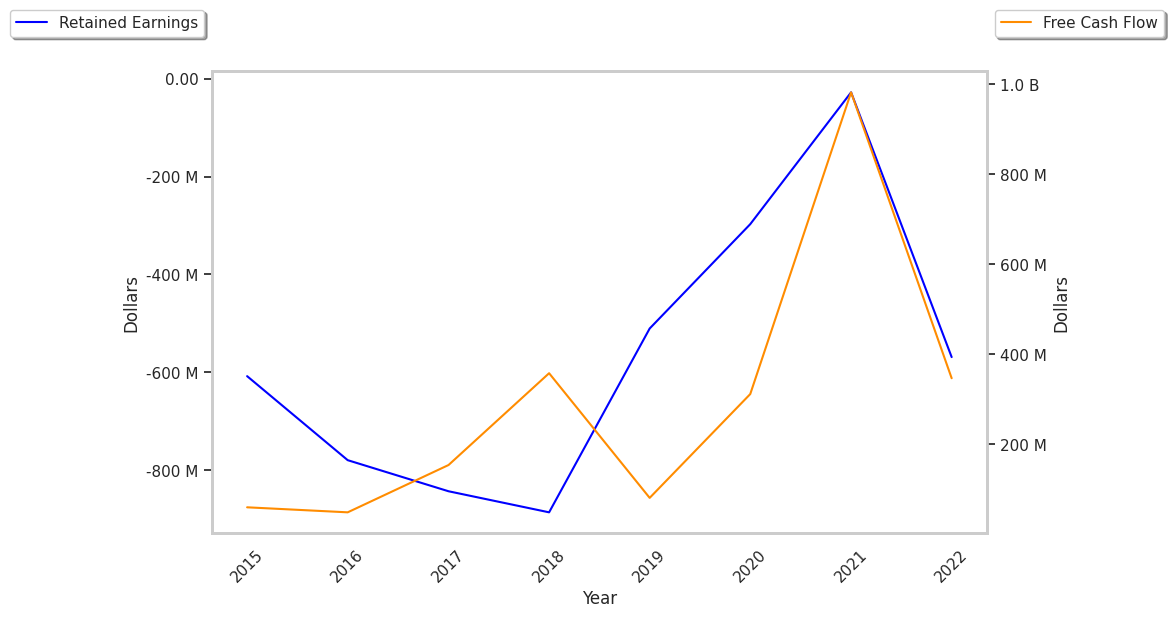
The Business Is Unprofitable and Its Balance Sheet Is Highly Leveraged:
| 2018 | 2019 | 2020 | 2021 | 2022 | 2023 | |
|---|---|---|---|---|---|---|
| Revenue (MM) | $3,298 | $4,714 | $9,498 | $17,661 | $17,532 | $20,793 |
| Revenue Growth | n/a | 42.91% | 101.5% | 85.95% | -0.73% | 18.61% |
| Gross Margins | 40% | 40% | 28% | 25% | 34% | 34% |
| Operating Margins | -1% | 8% | 2% | 1% | -3% | -1% |
| Net Margins | -1% | 8% | 2% | 1% | 0% | 0% |
| Net Income (MM) | -$38 | $375 | $213 | $166 | -$12 | -$14 |
| Net Interest Expense (MM) | $18 | -$0 | $292 | $29 | $95 | $27 |
| Depreciation & Amort. (MM) | $61 | $76 | $84 | $135 | $341 | $394 |
| Earnings Per Share | -$0.09 | $0.81 | $0.44 | $0.33 | -$0.93 | -$0.45 |
| EPS Growth | n/a | 1000.0% | -45.68% | -25.0% | -381.82% | 51.61% |
| Diluted Shares (MM) | 406 | 466 | 482 | 502 | 579 | 684 |
| Free Cash Flow (MM) | $234 | $265 | $35 | $714 | $5 | $796 |
| Capital Expenditures (MM) | $61 | $62 | $138 | $134 | $171 | $149 |
| Current Ratio | 2.07 | 1.9 | 1.88 | 1.78 | 1.85 | 1.91 |
| Long Term Debt (MM) | $900 | $939 | $2,587 | $4,559 | $4,987 | $4,968 |
| Net Debt / EBITDA | 42.95 | 2.56 | 9.04 | 9.52 | -16.55 | 27.55 |
Block's financial statements include several red flags such as slimmer gross margins than its peers, weak operating margins with a stable trend, and declining EPS growth. Additionally, the firm has a highly leveraged balance sheet. On the other hand, the company has growing revenues and increasing reinvestment in the business working in its favor. Furthermore, Block has irregular cash flows.
Block does not have a meaningful trailing P/E ratio since its earnings per share are currently in the red. Based on its EPS guidance of $3.07, the company has a forward P/E ratio of 16.3. In comparison, the average P/E ratio for the Technology sector is 35.0. On the other hand, the market is undervaluing Block in terms of its equity because its P/B ratio is 2.34. In comparison, the sector average is 7.92.
Block Has an Average Rating of Buy:
The 40 analysts following Block have set target prices ranging from $40.0 to $100.0 per share, for an average of $71.51 with a buy rating. As of April 2023, the company is trading -30.0% away from its average target price, indicating that there is an analyst consensus of some upside potential.
Block has an average amount of shares sold short because 3.8% of the company's shares are sold short. Institutions own 72.5% of the company's shares, and the insider ownership rate stands at 0.79%, suggesting a small amount of insider investors. The largest shareholder is Vanguard Group Inc, whose 6% stake in the company is worth $2,369,725,804.