We've been asking ourselves recently if the market has placed a fair valuation on General Electric Company. Let's dive into some of the fundamental values of this large-cap Technology company to determine if there might be an opportunity here for value-minded investors.
A Lower P/B Ratio Than Its Sector Average but Trades Above Its Graham Number:
General Electric Company operates as a high-tech industrial company in Europe, China, Asia, the Americas, the Middle East, and Africa. The company belongs to the Technology sector, which has an average price to earnings (P/E) ratio of 35.0 and an average price to book (P/B) ratio of 7.92. In contrast, General Electric Company has a trailing 12 month P/E ratio of 12.5 and a P/B ratio of 4.57.
General Electric Company's PEG ratio is 1.43, which shows that the stock is probably overvalued in terms of its estimated growth. For reference, a PEG ratio near or below 1 is a potential signal that a company is undervalued.
The Company's Revenues Are Declining:
| 2018 | 2019 | 2020 | 2021 | 2022 | 2023 | |
|---|---|---|---|---|---|---|
| Revenue (MM) | $113,543 | $113,543 | $58,025 | $56,469 | $58,100 | $65,359 |
| Revenue Growth | n/a | 0.0% | -48.9% | -2.68% | 2.89% | 12.49% |
| Gross Margins | -6% | 18% | -13% | -15% | -3% | 2% |
| Operating Margins | -18% | 0% | -11% | -9% | -1% | 15% |
| Net Margins | 0% | 0% | 10% | 0% | 1% | 15% |
| Net Income (MM) | -$89 | $66 | $5,704 | -$71 | $407 | $10,086 |
| Net Interest Expense (MM) | $2,321 | $2,479 | -$948 | $2,696 | $1,172 | $8,272 |
| Depreciation & Amort. (MM) | $5,562 | $2,018 | $1,895 | $3,645 | $1,338 | $1,531 |
| Earnings Per Share | -$2.62 | -$4.99 | $4.64 | -$6.0 | $0.05 | $8.82 |
| EPS Growth | n/a | -90.46% | 192.99% | -229.31% | 100.83% | 17540.0% |
| Diluted Shares (MM) | 8,691 | 1,091 | 1,094 | 1,098 | 1,096 | 1,096 |
| Free Cash Flow (MM) | -$13,947 | -$3,359 | -$17,407 | -$22,341 | -$4,975 | -$7,632 |
| Capital Expenditures (MM) | $18,925 | $12,197 | $20,818 | $25,822 | $10,891 | $14,169 |
| Current Ratio | 1.13 | 1.51 | 1.55 | 1.32 | 1.18 | 1.17 |
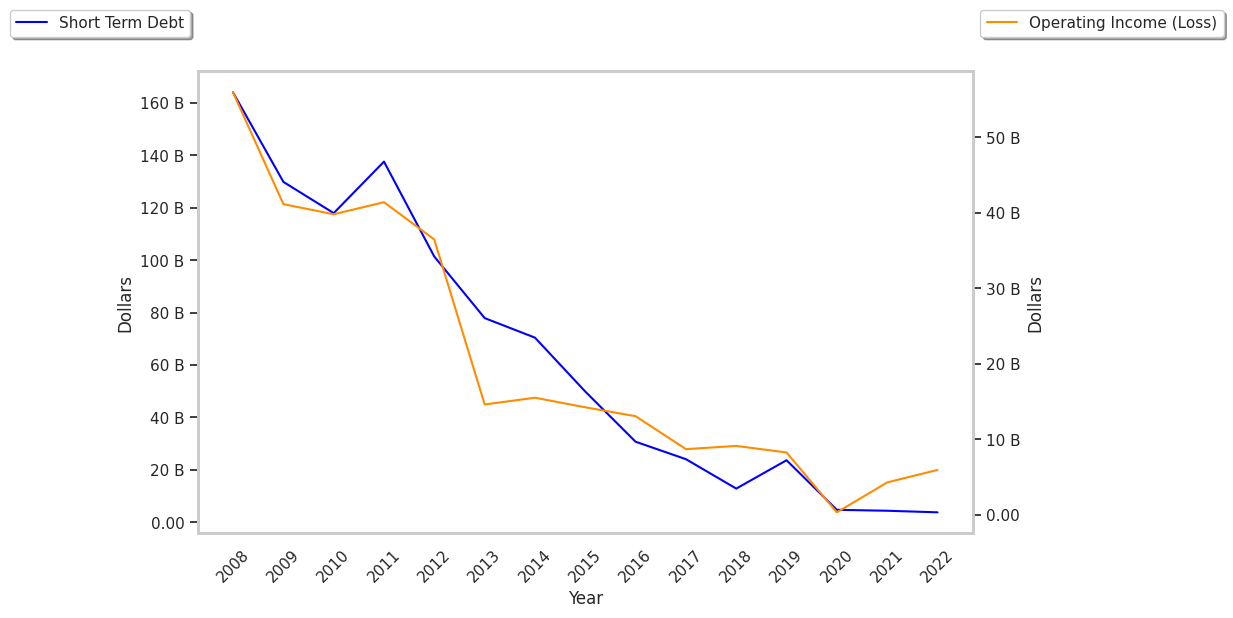
| Long Term Debt (MM) | $225,843 | $218,525 | $142,580 | $109,139 | $87,453 | $65,091 |
| Net Debt / EBITDA | -13.17 | 103.63 | -28.3 | -89.47 | 155.9 | 6.1 |
General Electric Company suffers from declining revenues and decreasing reinvestment in the business, slimmer gross margins than its peers, and consistently negative margins with a positive growth rate. The firm's financial statements also exhibit an unconvincing cash flow history and a highly leveraged balance sheet. On the other hand, the company has a strong EPS growth trend working in its favor.