It hasn't been a great afternoon session for Verizon Communications investors, who have watched their shares sink by -1.1% to a price of $38.22. Some of you might be wondering if it's time to buy the dip. If you are considering this, make sure to check the company's fundamentals first to determine if the shares are fairly valued at today's prices.
Verizon Communications's Earnings and Assets May Be Undervalued:
Verizon Communications Inc., through its subsidiaries, provides communications, technology, information, and entertainment products and services to consumers, businesses, and governmental entities worldwide. The company belongs to the Telecommunications sector, which has an average price to earnings (P/E) ratio of 23.78 and an average price to book (P/B) ratio of 3.46. In contrast, Verizon Communications has a trailing 12 month P/E ratio of 7.7 and a P/B ratio of 1.64.
Verizon Communications's PEG ratio is 15.49, which shows that the stock is probably overvalued in terms of its estimated growth. For reference, a PEG ratio near or below 1 is a potential signal that a company is undervalued.
Overview of the Company's Finances:
| 2018 | 2019 | 2020 | 2021 | 2022 | 2023 | |
|---|---|---|---|---|---|---|
| Revenue (MM) | $130,863 | $131,868 | $128,292 | $133,613 | $136,835 | $134,095 |
| Revenue Growth | n/a | 0.77% | -2.71% | 4.15% | 2.41% | -2.0% |
| Gross Margins | 17% | 23% | 22% | 24% | 22% | 22% |
| Operating Margins | 17% | 23% | 22% | 24% | 22% | 22% |
| Net Margins | 12% | 15% | 14% | 17% | 16% | 16% |
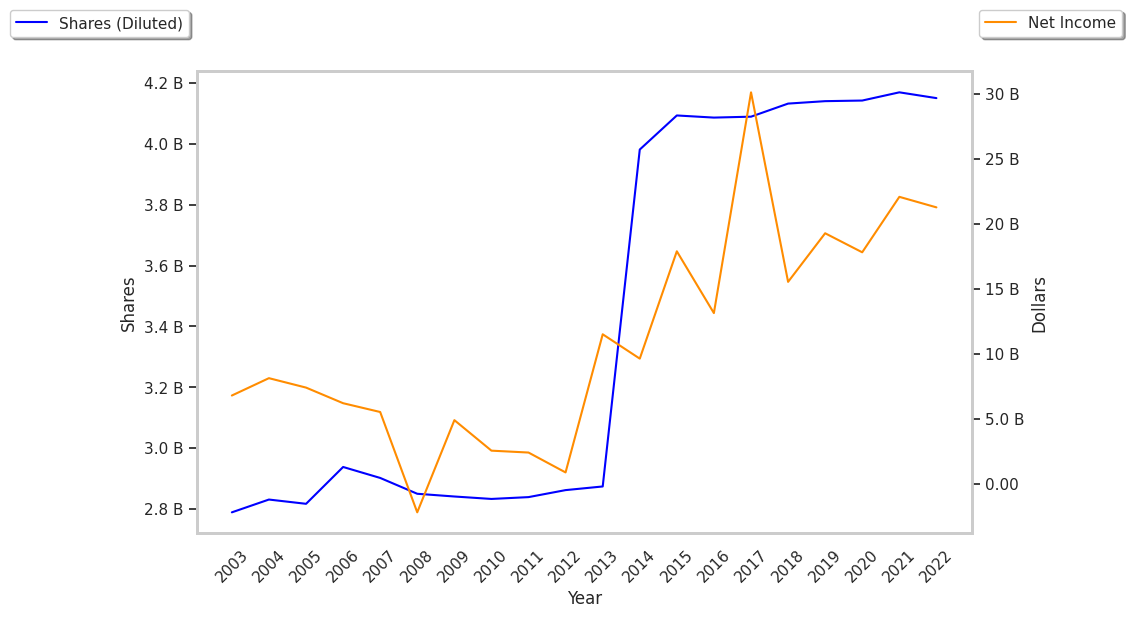
| Net Income (MM) | $16,039 | $19,788 | $18,348 | $22,618 | $21,748 | $21,366 |
| Net Interest Expense (MM) | $4,833 | $4,730 | $4,247 | $3,485 | $3,613 | $5,030 |
| Depreciation & Amort. (MM) | $17,403 | $16,682 | $16,720 | $16,206 | $17,099 | $17,326 |
| Earnings Per Share | $3.76 | $4.65 | $4.3 | $5.32 | $5.06 | $4.96 |
| EPS Growth | n/a | 23.67% | -7.53% | 23.72% | -4.89% | -1.98% |
| Diluted Shares (MM) | 4,132 | 4,140 | 4,142 | 4,150 | 4,204 | 4,236 |
| Free Cash Flow (MM) | $17,681 | $17,807 | $23,576 | $19,253 | $14,054 | $16,300 |
| Capital Expenditures (MM) | $16,658 | $17,939 | $18,192 | $20,286 | $23,087 | $21,440 |
| Current Ratio | 0.91 | 0.84 | 1.38 | 0.78 | 0.75 | 0.68 |
| Long Term Debt (MM) | $105,873 | $100,712 | $123,173 | $143,425 | $140,676 | $134,441 |
| Net Debt / EBITDA | 2.78 | 2.31 | 2.46 | 3.05 | 3.12 | 3.07 |
Verizon Communications has average net margins with a stable trend, irregular cash flows, and significant leverage. We also note that the company benefits from weak revenue growth and increasing reinvestment in the business and positive EPS growth. However, the firm has slimmer gross margins than its peers.