It's been a great overnight session for Morgan Stanley investors, who saw their shares rise 2.4% to a price of $82.28 per share. At these higher prices, is the company still fairly valued? If you are thinking about investing, make sure to check the company's fundamentals before making a decision.
Morgan Stanley's Valuation Is in Line With Its Sector Averages:
Morgan Stanley, a financial holding company, provides various financial products and services to corporations, governments, financial institutions, and individuals in the Americas, Europe, the Middle East, Africa, and Asia. The company belongs to the Finance sector, which has an average price to earnings (P/E) ratio of 12.38 and an average price to book (P/B) ratio of 1.58. In contrast, Morgan Stanley has a trailing 12 month P/E ratio of 14.7 and a P/B ratio of 1.49.
Morgan Stanley's PEG ratio is 1.8, which shows that the stock is probably overvalued in terms of its estimated growth. For reference, a PEG ratio near or below 1 is a potential signal that a company is undervalued.
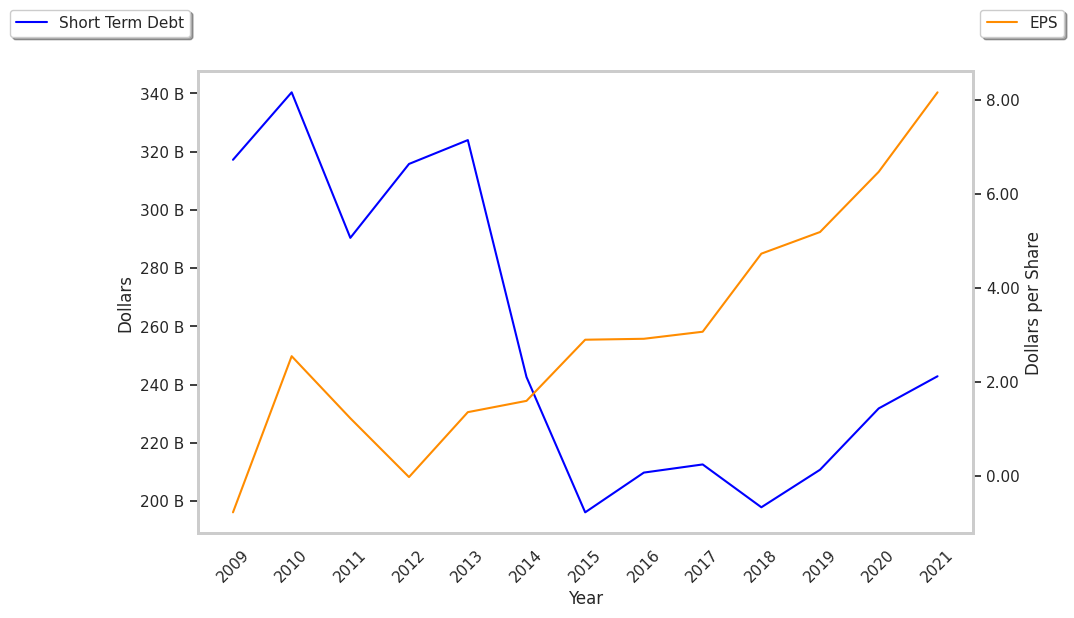
EPS Trend Sustained Primarily by Reducing the Number of Shares Outstanding:
| 2018 | 2019 | 2020 | 2021 | 2022 | 2023 | |
|---|---|---|---|---|---|---|
| Revenue (MM) | $40,107 | $41,538 | $48,757 | $59,755 | $53,668 | $53,996 |
| Revenue Growth | n/a | 3.57% | 17.38% | 22.56% | -10.19% | 0.61% |
| Interest Income (MM) | $10,086 | $12,404 | $6,313 | $8,045 | $12,268 | $36,803 |
| Operating Margins | 28% | 27% | 30% | 33% | 26% | 23% |
| Net Margins | 22% | 22% | 23% | 25% | 21% | 18% |
| Net Income (MM) | $8,887 | $9,237 | $11,179 | $15,120 | $11,179 | $9,955 |
| Depreciation & Amort. (MM) | $1,844 | $2,643 | $3,769 | $4,216 | $3,998 | $4,057 |
| Earnings Per Share | $4.73 | $5.19 | $6.46 | $8.03 | $6.15 | $5.59 |
| EPS Growth | n/a | 9.73% | 24.47% | 24.3% | -23.41% | -9.11% |
| Diluted Shares (MM) | 1,738 | 1,640 | 1,624 | 1,814 | 1,713 | 1,495 |
| Free Cash Flow (MM) | $5,440 | $38,947 | -$26,675 | $31,663 | -$9,475 | -$33,033 |
| Capital Expenditures (MM) | $1,865 | $1,826 | $1,444 | $2,308 | $3,078 | $3,253 |
| Current Ratio | 153.45 | 102.07 | 110.63 | 72.54 | 32.3 | 31.4 |
| Long Term Debt (MM) | $566,276 | $600,238 | $675,198 | $703,381 | $694,194 | $696,556 |
| LT Debt to Equity | 7.06 | 7.36 | 6.63 | 6.67 | 6.93 | 7.02 |