Enterprise Products Partners logged a -0.7% change during today's evening session, and is now trading at a price of $26.16 per share.
Enterprise Products Partners returned gains of 9.0% last year, with its stock price reaching a high of $27.95 and a low of $23.14. Over the same period, the stock underperformed the S&P 500 index by -6.4%. As of April 2023, the company's 50-day average price was $26.78. Enterprise Products Partners L.P. provides midstream energy services to producers and consumers of natural gas, natural gas liquids (NGLs), crude oil, petrochemicals, and refined products. The large-cap Utilities company is based in Houston, TX. Enterprise Products Partners has offered a 7.5% dividend yield over the last 12 months.
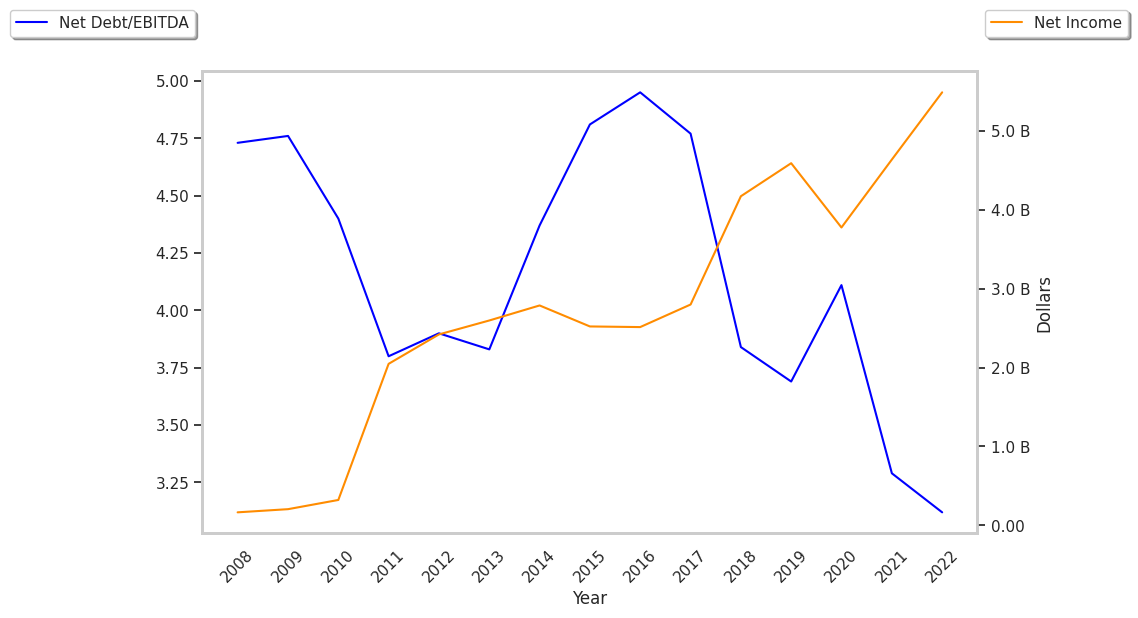
The Company May Be Profitable, but Its Balance Sheet Is Highly Leveraged:
| 2018 | 2019 | 2020 | 2021 | 2022 | 2023 | |
|---|---|---|---|---|---|---|
| Revenue (MM) | $36,534 | $32,789 | $27,200 | $40,807 | $58,186 | $48,743 |
| Revenue Growth | n/a | -10.25% | -17.05% | 50.03% | 42.59% | -16.23% |
| Operating Margins | 15% | 19% | 19% | 15% | 12% | 14% |
| Net Margins | 12% | 14% | 14% | 12% | 10% | 11% |
| Net Income (MM) | $4,238 | $4,687 | $3,886 | $4,755 | $5,615 | $5,507 |
| Net Interest Expense (MM) | $1,097 | $1,243 | $1,287 | $1,283 | $1,244 | $1,251 |
| Depreciation & Amort. (MM) | $1,792 | $1,949 | $2,072 | $1,705 | $1,779 | $1,829 |
| Diluted Shares (MM) | 2,187 | 2,202 | 2,202 | 2,203 | 2,199 | 2,185 |
| Free Cash Flow (MM) | $1,903 | $1,989 | $2,603 | $6,290 | $6,075 | $4,913 |
| Capital Expenditures (MM) | $4,223 | $4,532 | $3,288 | $2,223 | $1,964 | $3,015 |
| Current Ratio | 0.85 | 0.86 | 1.1 | 1.14 | 0.86 | 0.92 |
| Total Debt (MM) | $30,188 | $33,132 | $35,506 | $37,845 | $36,470 | $37,477 |
| Net Debt / EBITDA | 4.14 | 4.09 | 4.85 | 4.49 | 4.18 | 4.34 |
Enterprise Products Partners has growing revenues and decreasing reinvestment in the business, decent operating margins with a stable trend, and irregular cash flows. However, the firm has a highly leveraged balance sheet. Finally, we note that Enterprise Products Partners has positive expected EPS Growth.
Enterprise Products Partners Is Reasonably Valued:
Enterprise Products Partners has a trailing twelve month P/E ratio of 10.9, compared to an average of 17.53 for the Utilities sector. Based on its EPS guidance of $2.65, the company has a forward P/E ratio of 10.1. Furthermore, Enterprise Products Partners is likely overvalued compared to the book value of its equity, since its P/B ratio of 2.09 is higher than the sector average of 1.71.
Enterprise Products Partners Has an Average Rating of Buy:
The 19 analysts following Enterprise Products Partners have set target prices ranging from $28.0 to $35.0 per share, for an average of $31.89 with a buy rating. As of April 2023, the company is trading -16.0% away from its average target price, indicating that there is an analyst consensus of some upside potential.
Enterprise Products Partners has a very low short interest because 1.3% of the company's shares are sold short. Institutions own 26.8% of the company's shares, and the insider ownership rate stands at 32.7%, suggesting a large amount of insider shareholders. The largest shareholder is Alps Advisors Inc., whose 2% stake in the company is worth $992,619,625.