Macy's may be undervalued with poor growth indicators, but the 12 analysts following the company give it an rating of hold. Their target prices range from $11.0 to $19.0 per share, for an average of $14.75. At today's price of $20.27, Macy's is trading 37.42% away from its average target price, suggesting there is an analyst belief that shares are overpriced for the stock.
Macy's, Inc., an omni-channel retail organization, operates stores, websites, and mobile applications in the United States. Based in New York, NY, the mid-cap Consumer Discretionary company has 94,570 full time employees. Macy's has provided a 3.8% dividend yield over the last 12 months.
Macy's has a trailing twelve month P/E ratio of 8.3, compared to an average of 22.96 for the Consumer Discretionary sector. Considering its EPS guidance of $2.74, the company has a forward P/E ratio of 7.4.
The average compound growth rate of the company's historical and projected earnings per share is -8.5%. On this basis, the company's PEG ratio is -0.62, which indicates that its shares are overpriced.
On the other hand, the market is potentially undervaluing Macy's in terms of its book value because its P/B ratio is 1.34. In comparison, the sector average P/B ratio is 4.24. The company's shares are currently -46.6% below their Graham number, indicating that its shares have a margin of safety.
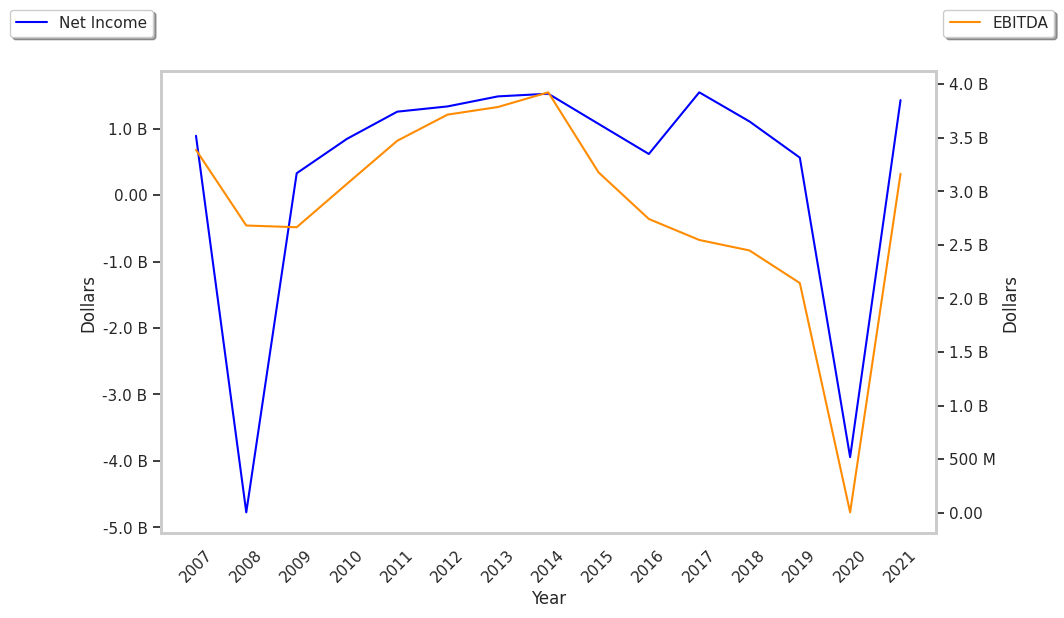
If analysts are giving the the company a mediocre rating despite its low valuation point, it could be related to the company's disappointing cash flows. Furthermore, Macy's has poor margins as you can see in the financial summary below.
| 2018 | 2019 | 2020 | 2021 | 2022 | 2023 | |
|---|---|---|---|---|---|---|
| Revenue (MM) | $24,837 | $24,971 | $24,560 | $17,346 | $24,460 | $24,442 |
| Revenue Growth | n/a | 0.54% | -1.65% | -29.37% | 41.01% | -0.07% |
| Gross Margins | 39% | 39% | 38% | 28% | 39% | 37% |
| Operating Margins | 8% | 7% | 4% | -26% | 10% | 7% |
| Net Interest Expense (MM) | $321 | $261 | $205 | $284 | $256 | $175 |
| Depreciation & Amort. (MM) | $991 | $962 | $981 | $959 | $874 | $857 |
| Earnings Per Share | $5.1 | $3.56 | $1.81 | -$12.68 | $4.55 | $4.19 |
| EPS Growth | n/a | -30.2% | -49.16% | -800.55% | 135.88% | -7.91% |
| Diluted Shares (MM) | 307 | 311 | 311 | 311 | 314 | 281 |
| Free Cash Flow (MM) | $1,489 | $1,078 | $636 | $311 | $2,358 | $727 |
| Capital Expenditures (MM) | $487 | $657 | $972 | $338 | $354 | $888 |
| Current Ratio | 1.34 | 1.28 | 1.11 | 1.14 | 1.09 | 1.26 |
| Long Term Debt (MM) | $5,469 | $4,677 | $4,852 | $3,295 | $2,996 | $2,997 |
| Net Debt / EBITDA | 2.54 | 2.21 | 2.77 | -0.89 | 0.88 | 0.99 |