Now trading at a price of $221.75, Norfolk Southern has moved 0.3% so far today.
Norfolk Southern returned losses of -12.7% last year, with its stock price reaching a high of $261.71 and a low of $183.09. Over the same period, the stock underperformed the S&P 500 index by -28.0%. As of April 2023, the company's 50-day average price was $203.06. Norfolk Southern Corporation, together with its subsidiaries, engages in the rail transportation of raw materials, intermediate products, and finished goods in the United States. Based in Atlanta, GA, the large-cap Industrials company has 19,300 full time employees. Norfolk Southern has offered a 2.4% dividend yield over the last 12 months.
Irregular Cash Flows With a Flat Trend:
| 2018 | 2019 | 2020 | 2021 | 2022 | 2023 | |
|---|---|---|---|---|---|---|
| Revenue (MM) | $11,458 | $11,296 | $9,789 | $11,142 | $12,745 | $12,320 |
| Revenue Growth | n/a | -1.41% | -13.34% | 13.82% | 14.39% | -3.33% |
| Operating Margins | 35% | 35% | 31% | 40% | 38% | 26% |
| Net Margins | 23% | 24% | 21% | 27% | 26% | 17% |
| Net Income (MM) | $2,666 | $2,722 | $2,013 | $3,005 | $3,270 | $2,090 |
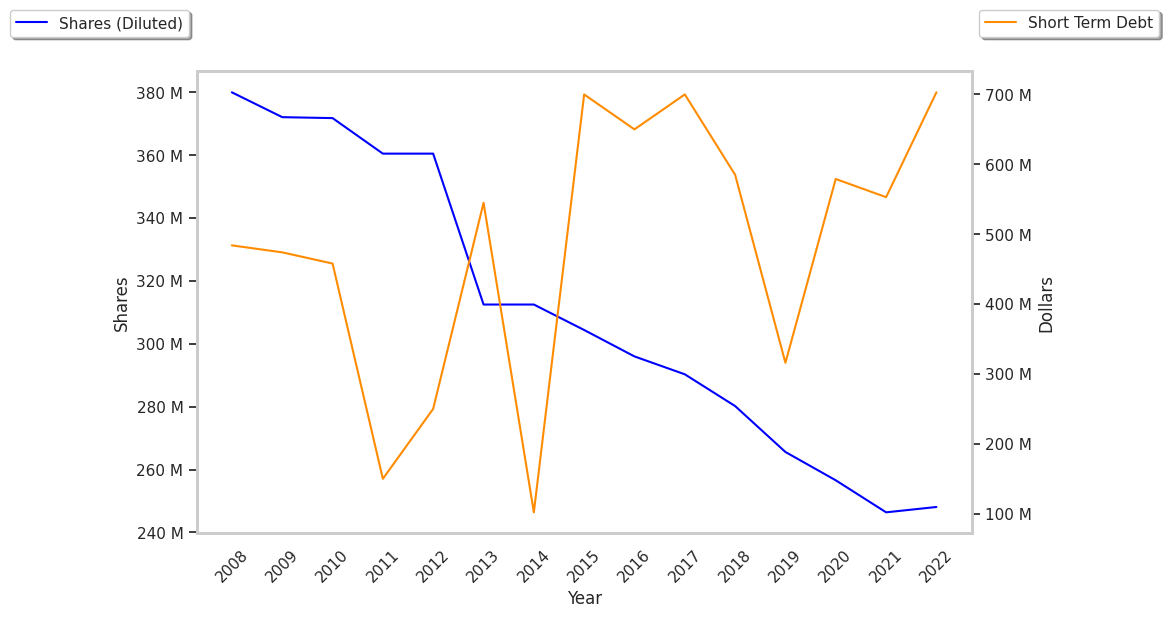
| Net Interest Expense (MM) | $557 | $604 | $625 | $646 | $692 | $704 |
| Depreciation & Amort. (MM) | $1,104 | $1,139 | $1,154 | $1,181 | $1,221 | $1,277 |
| Earnings Per Share | $9.51 | $10.25 | $7.84 | $12.11 | $13.88 | $9.1 |
| EPS Growth | n/a | 7.78% | -23.51% | 54.46% | 14.62% | -34.44% |
| Diluted Shares (MM) | 280 | 266 | 257 | 248 | 236 | 207 |
| Free Cash Flow (MM) | $1,775 | $1,873 | $2,143 | $2,785 | $2,274 | $1,142 |
| Capital Expenditures (MM) | $1,951 | $2,019 | $1,494 | $1,470 | $1,948 | $2,162 |
| Current Ratio | 0.72 | 0.9 | 1.07 | 0.86 | 0.76 | 1.08 |
| Total Debt (MM) | $11,145 | $12,196 | $12,681 | $13,840 | $15,182 | $16,584 |
| Net Debt / EBITDA | 2.13 | 2.27 | 2.78 | 2.31 | 2.44 | 3.35 |
Norfolk Southern has weak revenue growth and a flat capital expenditure trend, average net margins with a stable trend, and flat EPS growth. In addition, we note significant leverage. Furthermore, the firm has irregular cash flows.
Norfolk Southern's Valuation Is in Line With Its Sector Averages:
Norfolk Southern has a trailing twelve month P/E ratio of 22.2, compared to an average of 22.19 for the Industrials sector. Based on its EPS guidance of $12.91, the company has a forward P/E ratio of 15.7. The 4.5% compound average growth rate of Norfolk Southern's historical and projected earnings per share yields a PEG ratio of 4.98. This suggests that these shares are overvalued. In contrast, the market is likely undervaluing Norfolk Southern in terms of its equity because its P/B ratio is 3.98 while the sector average is 4.06. The company's shares are currently trading 98.4% above their Graham number.
Norfolk Southern Has an Average Rating of Buy:
The 23 analysts following Norfolk Southern have set target prices ranging from $170.0 to $264.0 per share, for an average of $228.96 with a buy rating. As of April 2023, the company is trading -11.3% away from its average target price, indicating that there is an analyst consensus of some upside potential.
Norfolk Southern has a very low short interest because 1.2% of the company's shares are sold short. Institutions own 77.6% of the company's shares, and the insider ownership rate stands at 0.14%, suggesting a small amount of insider investors. The largest shareholder is Vanguard Group Inc, whose 8% stake in the company is worth $4,103,471,332.