Now trading at a price of $62.85, W. P. Carey has moved 0.5% so far today.
W. P. Carey returned losses of -19.6% last year, with its stock price reaching a high of $84.17 and a low of $50.3. Over the same period, the stock underperformed the S&P 500 index by -35.0%. As of April 2023, the company's 50-day average price was $55.56. Celebrating its 50th anniversary, W. P. Carey ranks among the largest net lease REITs with a well-diversified portfolio of high-quality, operationally critical commercial real estate, which includes 1,413 net lease properties covering approximately 171 million square feet and a portfolio of 86 self-storage operating properties, pro forma for the Spin-Off of NLOP, as of September 30, 2023. With offices in New York, London, Amsterdam and Dallas, the company remains focused on investing primarily in single-tenant, industrial, warehouse and retail properties located in the U. Based in New York, NY, the large-cap Real Estate company has 193 full time employees. W. P. Carey has offered a 6.8% dividend yield over the last 12 months.
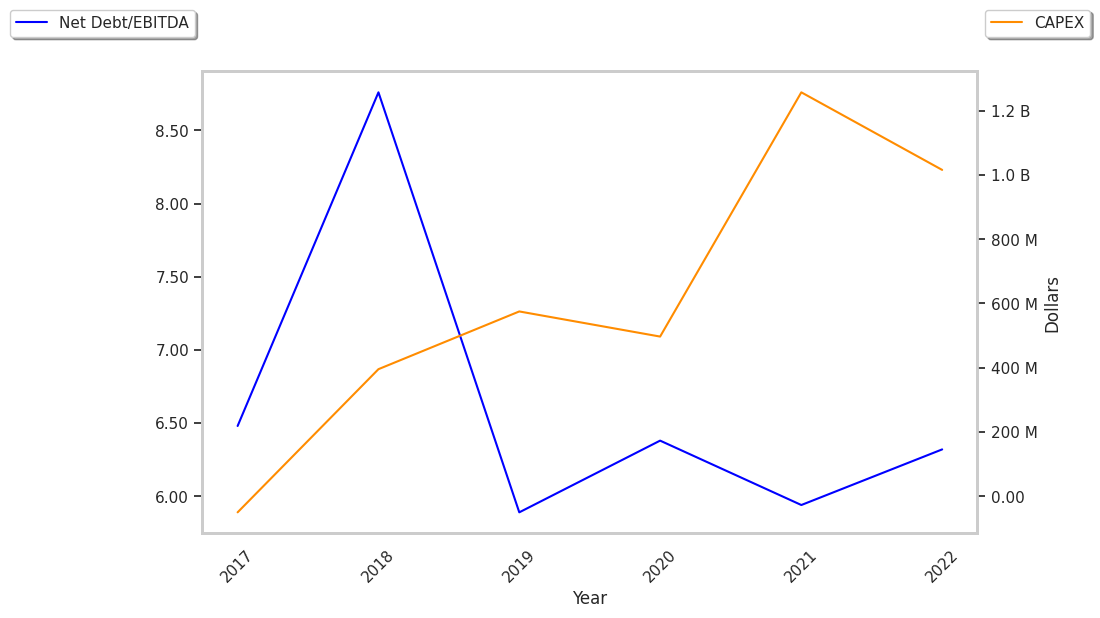
The Company May Be Profitable, but Its Balance Sheet Is Highly Leveraged:
| 2018 | 2019 | 2020 | 2021 | 2022 | 2023 | |
|---|---|---|---|---|---|---|
| Revenue (MM) | $886 | $1,233 | $1,209 | $1,332 | $1,479 | $1,732 |
| Revenue Growth | n/a | 39.18% | -1.9% | 10.11% | 11.08% | 17.07% |
| Operating Margins | 50% | 27% | 37% | 33% | 42% | 47% |
| Net Margins | 48% | 25% | 39% | 31% | 41% | 45% |
| Net Income (MM) | $424 | $307 | $466 | $410 | $599 | $774 |
| Net Interest Expense (MM) | $178 | $233 | $210 | $197 | $219 | $287 |
| Depreciation & Amort. (MM) | $298 | $460 | $456 | $491 | $520 | $605 |
| Diluted Shares (MM) | 118 | 171 | 175 | 183 | 200 | 252 |
| Free Cash Flow (MM) | $509 | $812 | $802 | $926 | $1,004 | $1,114 |
| Total Debt (MM) | $6,379 | $6,054 | $6,696 | $6,792 | $7,878 | $8,288 |
| Net Debt / EBITDA | 8.36 | 7.39 | 7.15 | 7.13 | 6.73 | 5.76 |
W. P. Carey has growing revenues and no capital expenditures, decent operating margins with a stable trend, and irregular cash flows. However, the firm suffers from negative expected EPS Growth and a highly leveraged balance sheet.
W. P. Carey's Earnings and Assets May Be Undervalued:
W. P. Carey has a trailing twelve month P/E ratio of 15.3, compared to an average of 25.55 for the Real Estate sector. Based on its EPS guidance of $2.01, the company has a forward P/E ratio of 27.6. In contrast, the market is likely undervaluing W. P. Carey in terms of its equity because its P/B ratio is 1.47 while the sector average is 2.1.
W. P. Carey Has an Analyst Consensus of Little Upside Potential:
The 9 analysts following W. P. Carey have set target prices ranging from $52.0 to $65.0 per share, for an average of $59.44 with a hold rating. As of April 2023, the company is trading -6.5% away from its average target price, indicating that there is an analyst consensus of little upside potential.
W. P. Carey has a very low short interest because 1.8% of the company's shares are sold short. Institutions own 65.1% of the company's shares, and the insider ownership rate stands at 1.08%, suggesting a large amount of insider shareholders. The largest shareholder is Vanguard Group Inc, whose 14% stake in the company is worth $1,893,472,602.