A strong performer from today's evening trading session is Arista Networks, whose shares rose 1.5% to $229.86 per share. For those of you thinking about investing in the stock, here is a brief value analysis of the stock using the company's basic fundamental ratios.
Arista Networks Has Elevated P/B and P/E Ratios:
Arista Networks, Inc. develops, markets, and sells cloud networking solutions in the Americas, Europe, the Middle East, Africa, and the Asia-Pacific. The company belongs to the Telecommunications sector, which has an average price to earnings (P/E) ratio of 23.78 and an average price to book (P/B) ratio of 3.46. In contrast, Arista Networks has a trailing 12 month P/E ratio of 38.3 and a P/B ratio of 10.99.
Arista Networks's PEG ratio is 1.78, which shows that the stock is probably overvalued in terms of its estimated growth. For reference, a PEG ratio near or below 1 is a potential signal that a company is undervalued.
Growing Revenues With Increasing Reinvestment in the Business:
| 2018 | 2019 | 2020 | 2021 | 2022 | 2023 | |
|---|---|---|---|---|---|---|
| Revenue (MM) | $2,151 | $2,411 | $2,318 | $2,948 | $4,381 | $5,595 |
| Revenue Growth | n/a | 12.05% | -3.87% | 27.21% | 48.62% | 27.71% |
| Operating Margins | 13% | 36% | 32% | 32% | 36% | 40% |
| Net Margins | 15% | 36% | 27% | 28% | 31% | 34% |
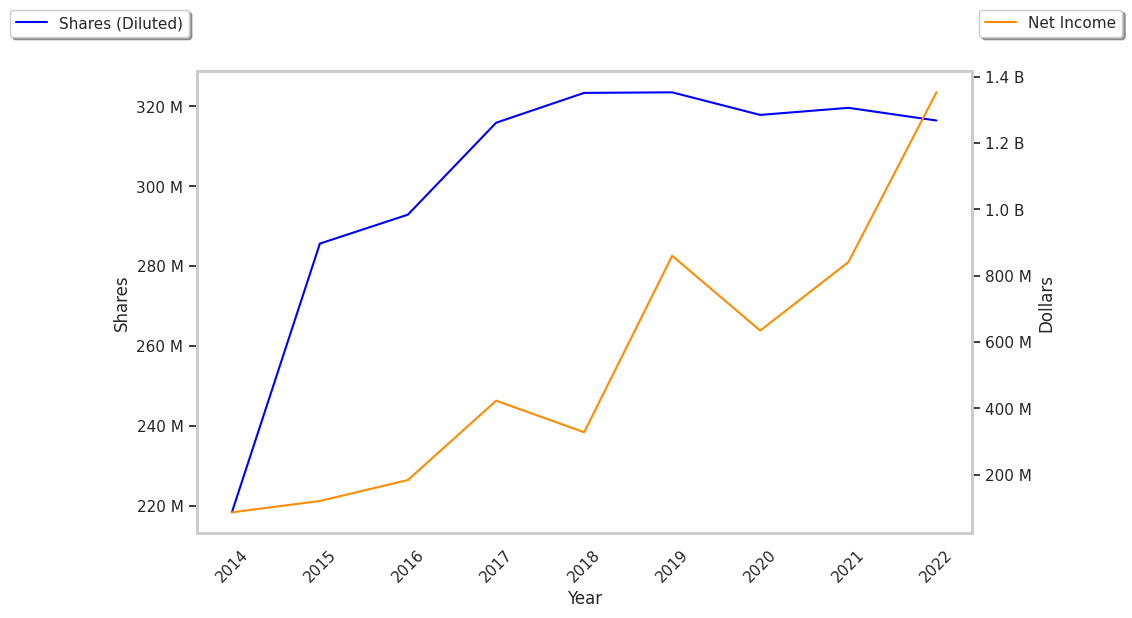
| Net Income (MM) | $328 | $860 | $635 | $841 | $1,352 | $1,901 |
| Net Interest Expense (MM) | $32 | $56 | $39 | $7 | $55 | $127 |
| Depreciation & Amort. (MM) | $28 | $33 | $35 | $50 | $63 | $74 |
| Earnings Per Share | $4.06 | $2.66 | $2.0 | $2.63 | $4.27 | $6.0 |
| EPS Growth | n/a | -34.48% | -24.81% | 31.5% | 62.36% | 40.52% |
| Diluted Shares (MM) | 81 | 324 | 318 | 319 | 316 | 316 |
| Free Cash Flow (MM) | $479 | $947 | $720 | $951 | $448 | $1,503 |
| Capital Expenditures (MM) | $24 | $16 | $15 | $65 | $45 | $45 |
| Current Ratio | 4.48 | 5.81 | 4.99 | 4.34 | 4.29 | 4.15 |
Arista Networks benefits from growing revenues and increasing reinvestment in the business, low leverage, and decent operating margins with a positive growth rate. The company's financial statements show positive EPS growth and irregular cash flows.