Today we're going to take a closer look at large-cap Industrials company Eaton, whose shares are currently trading at $237.05. We've been asking ourselves whether the company is under or over valued at today's prices... let's perform a brief value analysis to find out!
The Market May Be Overvaluing Eaton's Earnings and Assets:
Eaton Corporation plc operates as a power management company worldwide. The company belongs to the Industrials sector, which has an average price to earnings (P/E) ratio of 22.19 and an average price to book (P/B) ratio of 4.06. In contrast, Eaton has a trailing 12 month P/E ratio of 31.8 and a P/B ratio of 5.15.
Eaton's PEG ratio is 2.09, which shows that the stock is probably overvalued in terms of its estimated growth. For reference, a PEG ratio near or below 1 is a potential signal that a company is undervalued.
Irregular Cash Flows With a Flat Trend:
| 2018 | 2019 | 2020 | 2021 | 2022 | 2023 | |
|---|---|---|---|---|---|---|
| Revenue (MM) | $21,609 | $21,390 | $17,858 | $19,628 | $20,752 | $22,613 |
| Revenue Growth | n/a | -1.01% | -16.51% | 9.91% | 5.73% | 8.97% |
| Operating Margins | 11% | 12% | 10% | 15% | 14% | 16% |
| Net Interest Expense (MM) | -$9 | -$73 | -$149 | -$40 | $36 | $77 |
| Depreciation & Amort. (MM) | $903 | $884 | $811 | $922 | $954 | $933 |
| Earnings Per Share | $4.91 | $5.25 | $3.49 | $5.34 | $6.14 | $7.460000000000001 |
| EPS Growth | n/a | 6.92% | -33.52% | 53.01% | 14.98% | 21.5% |
| Diluted Shares (MM) | 437 | 421 | 404 | 402 | 401 | 401 |
| Capital Expenditures (MM) | $565 | $587 | $389 | $575 | $598 | $723 |
| Current Ratio | 1.47 | 1.7 | 1.56 | 1.04 | 1.38 | 1.45 |
| Total Debt (MM) | $7,521 | $8,647 | $8,066 | $8,594 | $8,665 | $9,159 |
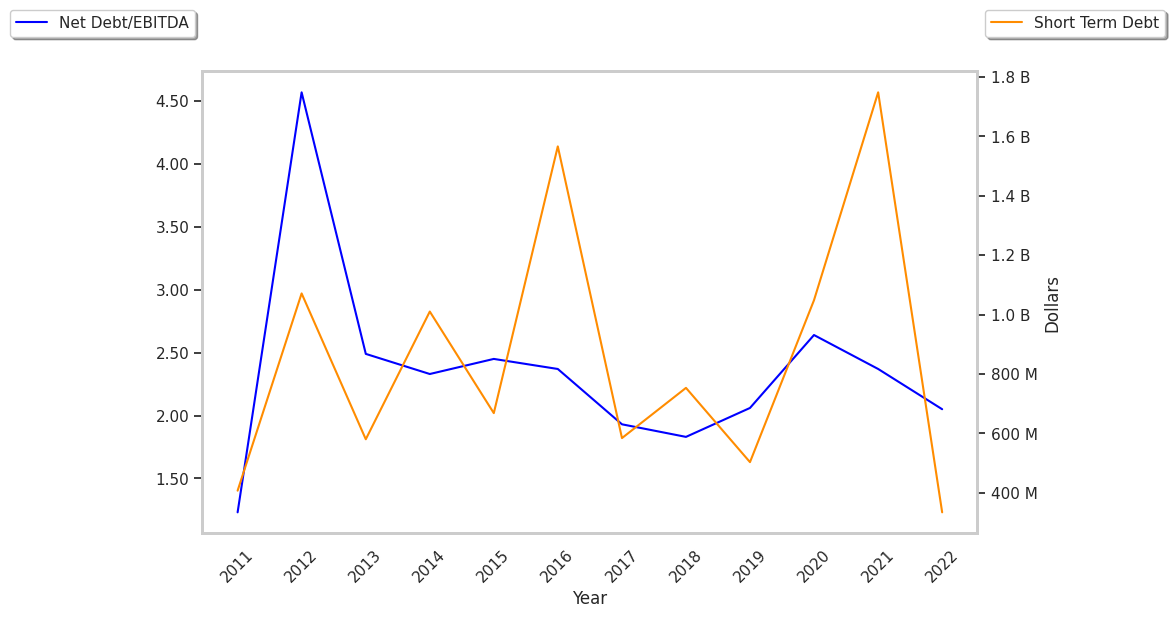
| Net Debt / EBITDA | 2.18 | 2.38 | 2.98 | 2.17 | 2.17 | 1.95 |