Pharmaceutical company Intra-Cellular Therapies is standing out today, surging to $64.4 and marking a 7.5% change. In comparison the S&P 500 moved only 0.0%. ITCI is -16.75% below its average analyst target price of $77.36, which implies there is more upside for the stock.
As such, the average analyst rates it at buy. Over the last year, Intra-Cellular Therapies has underperfomed the S&P 500 by 5.0%, moving 10.0%.
Intra-Cellular Therapies, Inc., a biopharmaceutical company, focuses on the discovery, clinical development, and commercialization of small molecule drugs that address medical needs primarily in neuropsychiatric and neurological disorders by targeting intracellular signaling mechanisms in the central nervous system (CNS) in the United States. The company is part of the healthcare sector. Healthcare companies work in incredibly complex markets, and their valuations can change in an instant based on a denied drug approval, a research and development breakthrough at a competitor, or a new government regulation. In the longer term, healthcare companies are affected by factors as varied as demographics and epidemiology. Investors who want to understand the healthcare market should be prepared for deep dives into a wide range of topics.
Intra-Cellular Therapies does not publish either its forward or trailing P/E ratios because their values are negative -- meaning that each share of stock represents a net earnings loss. But we can calculate these P/E ratios anyways using the stocks forward and trailing (EPS) values of $-0.48 and $-1.62. We can see that ITCI has a forward P/E ratio of -134.2 and a trailing P/E ratio of -39.8.
The P/E ratio is the company's share price divided by its earnings per share. In other words, it represents how much investors are willing to spend for each dollar of the company's earnings (revenues minus the cost of goods sold, taxes, and overhead). As of the first quarter of 2023, the health care sector has an average P/E ratio of 30.21, and the average for the S&P 500 is 15.97.
The main limitation with P/E ratios is that they don't take into account the growth of earnings. This means that a company with a higher than average P/E ratio may still be undervalued if it has high projected earnings growth. Conversely, a company with a low P/E ratio may not present a good value proposition if its projected earnings are stagnant.
When we divide Intra-Cellular Therapies's P/E ratio by its projected 5 year earnings growth rate, we obtain its Price to Earnings Growth (PEG) ratio of -0.38. Since a PEG ratio of 1 or less may indicate that the company's valuation is proportionate to its growth potential, we see here that investors are undervaluing ITCI's growth potential .
To better understand the strength of Intra-Cellular Therapies's business, we can analyse its operating margins, which are its revenues minus its operating costs. Consistently strong margins backed by a positive trend can signal that a company is on track to deliver returns for its shareholders. Here's the operating margin statistics for the last four years:
| Date Reported | Total Revenue ($ k) | Operating Expenses ($ k) | Operating Margins (%) | YoY Growth (%) |
|---|---|---|---|---|
| 2023 | 420,140 | 592,836 | -37 | 63.73 |
| 2022 | 250,314 | 513,940 | -102 | 69.91 |
| 2021 | 83,803 | 369,491 | -339 | 65.9 |
| 2020 | 22,813 | 254,041 | -994 | 99.59 |
| 2019 | 61 | 154,072 | -243711 | -286.22 |
| 2018 | 246 | 162,267 | -63101 |
- Average operating margins: -51380.7 %
- Average operating margins growth rate: 71.1 %
- Coefficient of variability (lower numbers indicate less volatility): 0.32 %
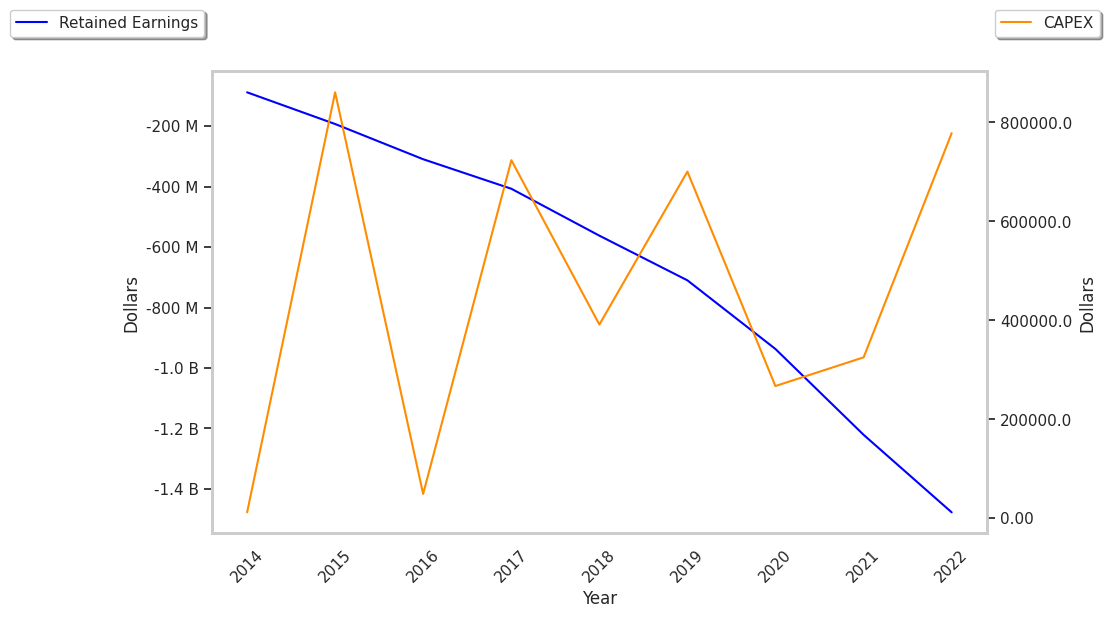
Intra-Cellular Therapies's financial viability can also be assessed through a review of its free cash flow trends. Free cash flow refers to the company's operating cash flows minus its capital expenditures, which are expenses related to the maintenance of fixed assets such as land, infrastructure, and equipment. Over the last four years, the trends have been as follows:
| Date Reported | Cash Flow from Operations ($ k) | Capital expenditures ($ k) | Free Cash Flow ($ k) | YoY Growth (%) |
|---|---|---|---|---|
| 2023 | -161,331 | 240 | -161,571 | 40.37 |
| 2022 | -270,186 | 778 | -270,964 | -4.27 |
| 2021 | -259,544 | 325 | -259,869 | -12.82 |
| 2020 | -230,073 | 267 | -230,340 | -79.0 |
| 2019 | -127,983 | 700 | -128,684 | -8.54 |
| 2018 | -118,169 | 391 | -118,560 |
- Average free cash flow: $-194998002.8
- Average free cash flown growth rate: -11.8 %
- Coefficient of variability (lower numbers indicating more stability): 398.89 %
If it weren't negative, the free cash flow would represent the amount of money available for reinvestment in the business, or for payments to equity investors in the form of a dividend. While a negative cash flow for one or two quarters is not a sign of financial troubles for ITCI, a long term trend of negative or highly erratic cash flow levels may indicate a struggling business or a mismanaged company.
Value investors often analyze stocks through the lens of its Price to Book (P/B) Ratio (market value divided by book value). The book value refers to the present value of the company if the company were to sell off all of its assets and pay all of its debts today - a number whose value may differ significantly depending on the accounting method.
Intra-Cellular Therapies's P/B ratio indicates that the market value of the company exceeds its book value by a factor of 10, so the company's assets may be overvalued compared to the average P/B ratio of the Health Care sector, which stands at 4.08 as of the first quarter of 2023.
With a negative P/E ratio, an elevated P/B ratio, and negative cash flows with a downwards trend, we can conclude that Intra-Cellular Therapies is probably overvalued at current prices. The stock presents poor growth indicators because of its consistently poor operating margins with a positive growth rate, and no PEG ratio.