We've been asking ourselves recently if the market has placed a fair valuation on Old Dominion Freight Line. Let's dive into some of the fundamental values of this large-cap Industrials company to determine if there might be an opportunity here for value-minded investors.
Old Dominion Freight Line's P/B and P/E Ratios Are Higher Than Average:
Old Dominion Freight Line, Inc. operates as a less-than-truckload (LTL) motor carrier in the United States and North America. The company belongs to the Industrials sector, which has an average price to earnings (P/E) ratio of 22.19 and an average price to book (P/B) ratio of 4.06. In contrast, Old Dominion Freight Line has a trailing 12 month P/E ratio of 34.0 and a P/B ratio of 10.27.
Old Dominion Freight Line's PEG ratio is 3.69, which shows that the stock is probably overvalued in terms of its estimated growth. For reference, a PEG ratio near or below 1 is a potential signal that a company is undervalued.
Growing Revenues With Increasing Reinvestment in the Business:
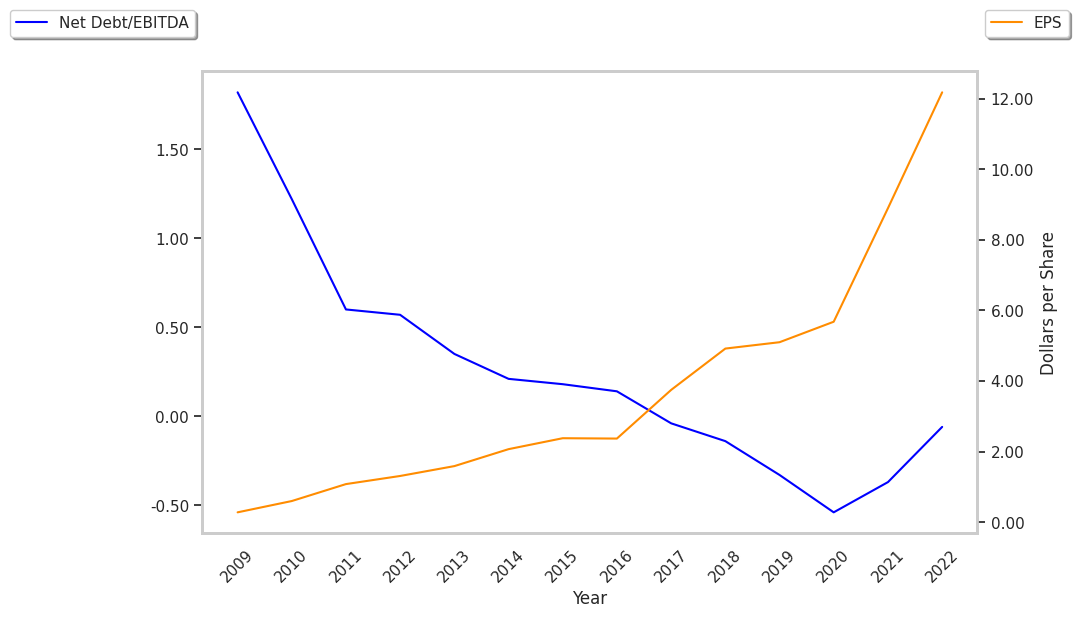
| 2018 | 2019 | 2020 | 2021 | 2022 | 2023 | |
|---|---|---|---|---|---|---|
| Revenue (MM) | $4,044 | $4,109 | $4,015 | $5,256 | $6,260 | $5,862 |
| Revenue Growth | n/a | 1.62% | -2.29% | 30.91% | 19.1% | -6.35% |
| Operating Margins | 20% | 20% | 23% | 26% | 28% | 28% |
| Net Margins | 15% | 15% | 17% | 20% | 22% | 21% |
| Net Income (MM) | $606 | $616 | $673 | $1,034 | $1,377 | $1,241 |
| Net Interest Expense (MM) | $0 | $5 | $3 | $2 | $2 | $5 |
| Depreciation & Amort. (MM) | $230 | $254 | $261 | $260 | $276 | $312 |
| Earnings Per Share | $4.92 | $5.1 | $5.68 | $8.89 | $12.18 | $12.1 |
| EPS Growth | n/a | 3.66% | 11.37% | 56.51% | 37.01% | -0.66% |
| Diluted Shares (MM) | 123 | 121 | 118 | 116 | 113 | 103 |
| Free Cash Flow (MM) | $312 | $505 | $708 | $663 | $916 | $572 |
| Capital Expenditures (MM) | $588 | $479 | $225 | $550 | $775 | $922 |
| Current Ratio | 1.98 | 2.37 | 3.33 | 2.98 | 1.76 | 1.73 |
| Total Debt (MM) | $95 | $86 | $142 | $141 | $137 | $114 |
| Net Debt / EBITDA | -0.09 | -0.29 | -0.22 | -0.19 | -0.02 | -0.05 |
Old Dominion Freight Line benefits from growing revenues and increasing reinvestment in the business, strong margins with a positive growth rate, and low leverage. The company's financial statements show a strong EPS growth trend and irregular cash flows.