Now trading at a price of $54.12, Howmet Aerospace has moved -0.0% so far today.
Howmet Aerospace returned gains of 38.8% last year, with its stock price reaching a high of $54.4 and a low of $37.25. Over the same period, the stock outperformed the S&P 500 index by 22.6%. More recently, the company's 50-day average price was $48.4. Howmet Aerospace Inc. provides advanced engineered solutions for the aerospace and transportation industries in the United States, Japan, France, Germany, the United Kingdom, Mexico, Italy, Canada, Poland, China, and internationally. Based in Pittsburgh, PA, the large-cap Industrials company has 21,400 full time employees. Howmet Aerospace has offered a 0.3% dividend yield over the last 12 months.
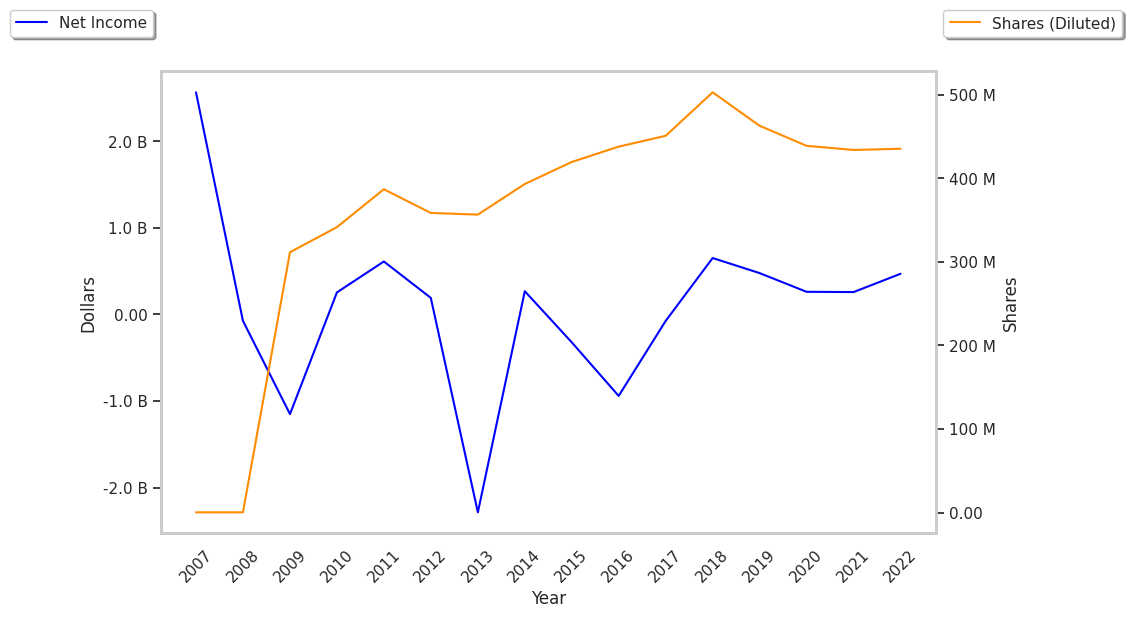
EPS Trend Sustained Primarily by Reducing the Number of Shares Outstanding:
| 2018 | 2019 | 2020 | 2021 | 2022 | 2023 | |
|---|---|---|---|---|---|---|
| Revenue (MM) | $6,778 | $7,098 | $5,259 | $4,972 | $5,663 | $6,422 |
| Revenue Growth | n/a | 4.72% | -25.91% | -5.46% | 13.9% | 13.4% |
| Operating Margins | 13% | 8% | 12% | 15% | 16% | 17% |
| Net Margins | 10% | 7% | 5% | 5% | 8% | 10% |
| Net Income (MM) | $651 | $477 | $261 | $258 | $469 | $640 |
| Net Interest Expense (MM) | $38 | $338 | $317 | $259 | $229 | $223 |
| Depreciation & Amort. (MM) | $576 | $536 | $338 | $270 | $265 | $271 |
| Diluted Shares (MM) | 503 | 463 | 439 | 435 | 421 | 404 |
| Free Cash Flow (MM) | -$551 | $461 | -$258 | $250 | $540 | $689 |
| Current Ratio | 1.87 | 1.42 | 2.21 | 2.18 | 2.12 | 2.14 |
| Total Debt (MM) | $6,330 | $10,274 | $5,075 | $4,306 | $4,237 | $4,047 |
| Net Debt / EBITDA | 2.81 | 7.8 | 3.59 | 3.52 | 2.91 | 2.65 |
Howmet Aerospace's financial statements include several red flags such as weak revenue growth and decreasing reinvestment in the business, weak operating margins with a stable trend, and EPS growth achieved by reducing the number of outstanding shares. Additionally, the firm has a highly leveraged balance sheet. On the other hand, the company has irregular cash flows working in its favor.
The Market May Be Overvaluing Howmet Aerospace's Earnings and Assets:
Howmet Aerospace has a trailing twelve month P/E ratio of 31.4, compared to an average of 22.19 for the Industrials sector. Based on its EPS guidance of $2.15, the company has a forward P/E ratio of 22.5. The 7.5% compound average growth rate of Howmet Aerospace's historical and projected earnings per share yields a PEG ratio of 4.22. This suggests that these shares are overvalued. Furthermore, Howmet Aerospace is likely overvalued compared to the book value of its equity, since its P/B ratio of 5.84 is higher than the sector average of 4.06.
Howmet Aerospace Has an Average Rating of Buy:
The 17 analysts following Howmet Aerospace have set target prices ranging from $47.0 to $61.0 per share, for an average of $56.29 with a buy rating. As of April 2023, the company is trading -14.0% away from its average target price, indicating that there is an analyst consensus of some upside potential.
Howmet Aerospace has a very low short interest because 1.0% of the company's shares are sold short. Institutions own 90.7% of the company's shares, and the insider ownership rate stands at 0.69%, suggesting a small amount of insider investors. The largest shareholder is Vanguard Group Inc, whose 11% stake in the company is worth $2,379,802,477.