It hasn't been a great afternoon session for Live Nation Entertainment investors, who have watched their shares sink by -2.0% to a price of $88.27. Some of you might be wondering if it's time to buy the dip. If you are considering this, make sure to check the company's fundamentals first to determine if the shares are fairly valued at today's prices.
The Market May Be Overvaluing Live Nation Entertainment's Earnings and Assets:
Live Nation Entertainment, Inc. operates as a live entertainment company. The company belongs to the Consumer Discretionary sector, which has an average price to earnings (P/E) ratio of 22.96 and an average price to book (P/B) ratio of 4.24. In contrast, Live Nation Entertainment has a trailing 12 month P/E ratio of 58.8 and a P/B ratio of 90.91.
When we divideLive Nation Entertainment's P/E ratio by its expected five-year EPS growth rate, we obtain a PEG ratio of 0.66, which indicates that the market is undervaluing the company's projected growth (a PEG ratio of 1 indicates a fairly valued company). Your analysis of the stock shouldn't end here. Rather, a good PEG ratio should alert you that it may be worthwhile to take a closer look at the stock.
Growing Revenues With Increasing Reinvestment in the Business:
| 2018 | 2019 | 2020 | 2021 | 2022 | 2023 | |
|---|---|---|---|---|---|---|
| Revenue (MM) | $10,788 | $11,548 | $1,861 | $6,268 | $16,681 | $21,201 |
| Revenue Growth | n/a | 7.05% | -83.88% | 236.8% | 166.11% | 27.09% |
| Operating Margins | 3% | 3% | -89% | -7% | 4% | 5% |
| Net Margins | 1% | 1% | -6% | 1% | 2% | 4% |
| Net Income (MM) | $90 | $118 | -$103 | $42 | $409 | $749 |
| Net Interest Expense (MM) | $141 | $158 | $227 | $282 | $278 | $330 |
| Depreciation & Amort. (MM) | $387 | $444 | $485 | $416 | $450 | $514 |
| Free Cash Flow (MM) | $702 | $146 | -$1,297 | $1,628 | $1,485 | $1,220 |
| Capital Expenditures (MM) | $240 | $324 | $214 | $153 | $347 | $446 |
| Current Ratio | 1.03 | 1.02 | 0.96 | 0.97 | 0.98 | 1.14 |
| Total Debt (MM) | $4,005 | $4,501 | $5,404 | $7,403 | $7,846 | $11,266 |
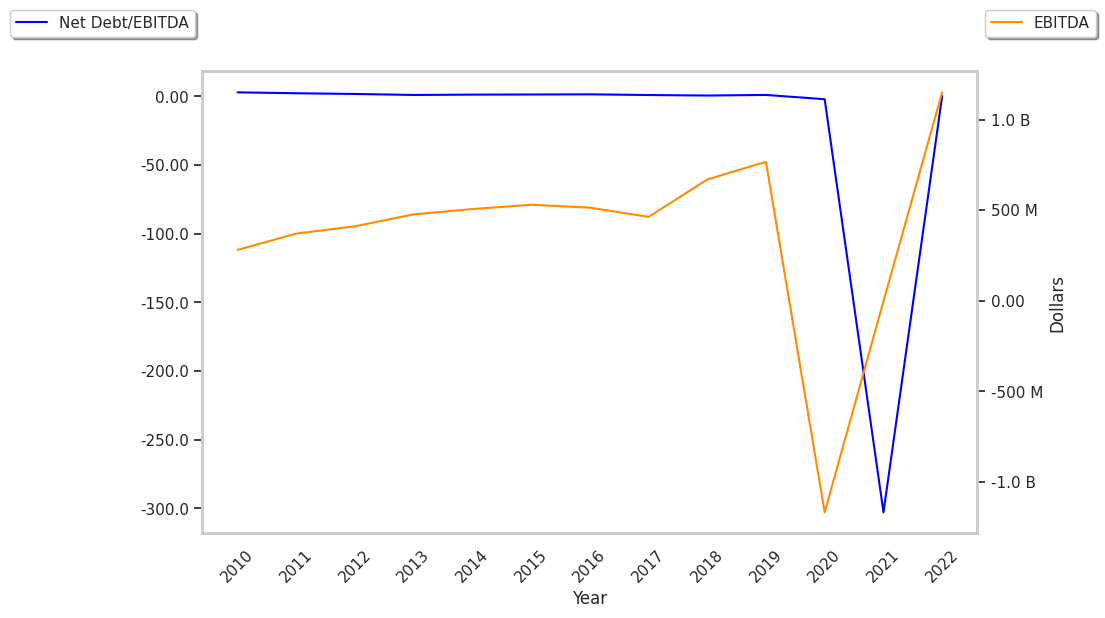
| Net Debt / EBITDA | 2.48 | 2.64 | -2.45 | -1593.12 | 1.89 | 3.45 |