It's been a great afternoon session for 3M Company investors, who saw their shares rise 1.4% to a price of $103.97 per share. At these higher prices, is the company still fairly valued? If you are thinking about investing, make sure to check the company's fundamentals before making a decision.
The Market May Be Overvaluing 3M Company's Earnings and Assets:
3M Company provides diversified technology services in the United States and internationally. The company belongs to the Health Care sector, which has an average price to earnings (P/E) ratio of 30.21 and an average price to book (P/B) ratio of 4.08. In contrast, 3M Company has a trailing 12 month P/E ratio of -7.8 and a P/B ratio of 12.29.
3M Company has moved -18.7% over the last year compared to 16.2% for the S&P 500 — a difference of -34.9%. 3M Company has a 52 week high of $129.9 and a 52 week low of $85.35.
Shareholders Are Confronted With a Declining EPS Growth Trend:
| 2018 | 2019 | 2020 | 2021 | 2022 | 2023 | |
|---|---|---|---|---|---|---|
| Revenue (MM) | $32,765 | $32,136 | $32,184 | $35,355 | $34,229 | $32,747 |
| Revenue Growth | n/a | -1.92% | 0.15% | 9.85% | -3.18% | -4.33% |
| Operating Margins | 22% | 19% | 22% | 21% | 19% | 20% |
| Net Margins | 16% | 14% | 17% | 17% | 17% | 0% |
| Net Income (MM) | $5,363 | $4,529 | $5,458 | $5,929 | $5,791 | $16 |
| Net Interest Expense (MM) | $350 | $448 | $529 | $488 | $462 | $686 |
| Depreciation & Amort. (MM) | $1,488 | $1,593 | $1,911 | $1,915 | $1,831 | $1,910 |
| Earnings Per Share | $8.89 | $7.72 | $9.36 | $10.12 | $10.18 | -$13.32 |
| EPS Growth | n/a | -13.16% | 21.24% | 8.12% | 0.59% | -230.84% |
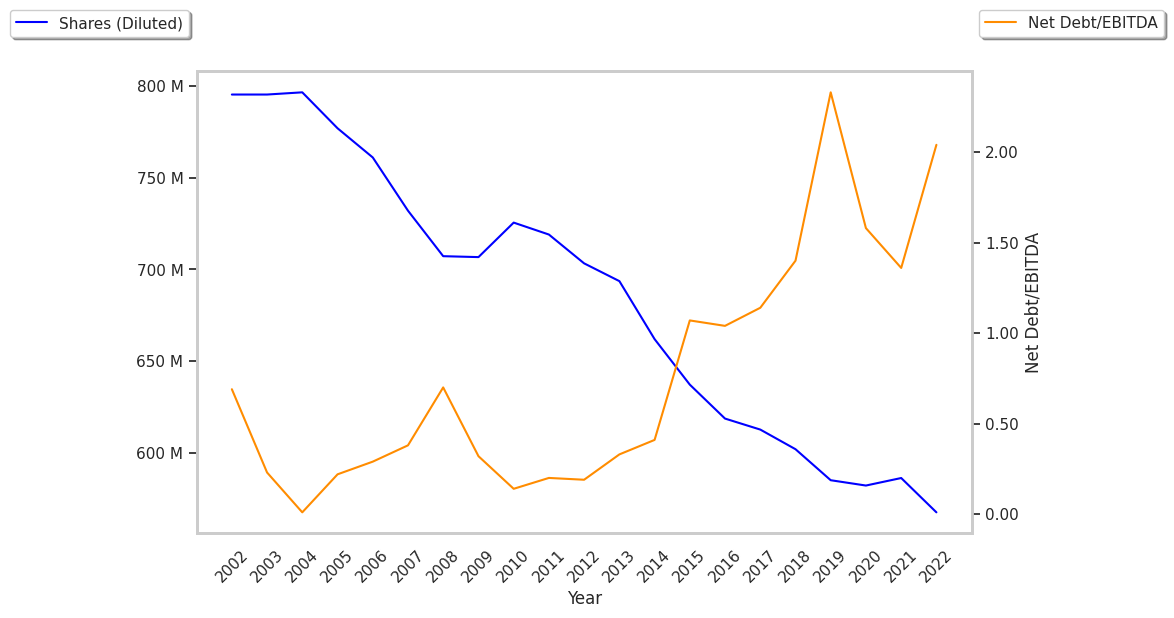
| Diluted Shares (MM) | 602 | 585 | 582 | 585 | 568 | 511 |
| Free Cash Flow (MM) | $4,862 | $5,371 | $6,612 | $5,851 | $3,842 | $4,853 |
| Capital Expenditures (MM) | $1,577 | $1,699 | $1,501 | $1,603 | $1,749 | $1,763 |
| Current Ratio | 1.89 | 1.41 | 1.89 | 1.7 | 1.54 | 1.05 |
| Total Debt (MM) | $15,367 | $22,154 | $19,589 | $16,276 | $14,843 | $16,013 |
| Net Debt / EBITDA | 1.44 | 1.86 | 1.65 | 1.26 | 1.34 | 1.31 |