Tesla logged a 1.0% change during today's evening session, and is now trading at a price of $239.29 per share.
Tesla returned gains of 51.2% last year, with its stock price reaching a high of $299.29 and a low of $101.81. Over the same period, the stock outperformed the S&P 500 index by 34.9%. More recently, the company's 50-day average price was $233.88. Tesla, Inc. designs, develops, manufactures, leases, and sells electric vehicles, and energy generation and storage systems in the United States, China, and internationally. Based in Austin, TX, the large-cap Consumer Discretionary company has 127,855 full time employees. Tesla has not offered a dividend during the last year.
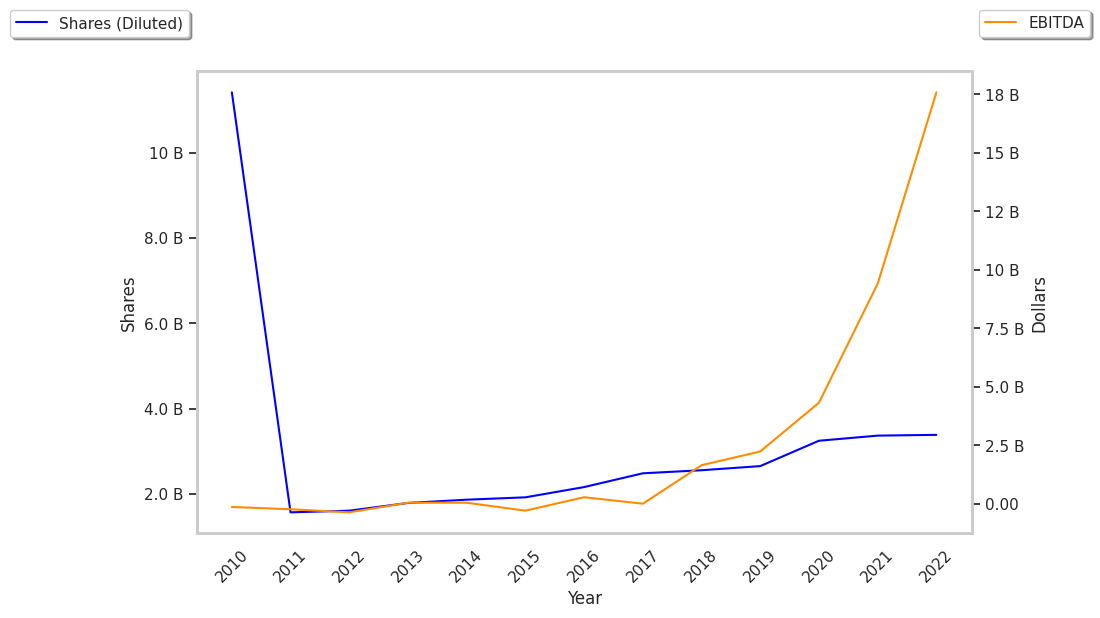
Growing Revenues With Increasing Reinvestment in the Business:
| 2018 | 2019 | 2020 | 2021 | 2022 | 2023 | |
|---|---|---|---|---|---|---|
| Revenue (MM) | $21,461 | $24,578 | $31,536 | $53,823 | $81,462 | $95,924 |
| Revenue Growth | n/a | 14.52% | 28.31% | 70.67% | 51.35% | 17.75% |
| Operating Margins | -2% | 0% | 6% | 12% | 17% | 12% |
| Net Margins | 0% | 0% | 3% | 10% | 15% | 11% |
| Net Income (MM) | -$87 | $87 | $862 | $5,644 | $12,587 | $10,795 |
| Net Interest Expense (MM) | $663 | $685 | $748 | $371 | $191 | $275 |
| Depreciation & Amort. (MM) | $1,110 | $1,370 | $1,570 | $1,910 | $2,420 | $3,106 |
| Earnings Per Share | -$0.1 | $0.1 | $0.27 | $1.67 | $3.62 | $3.08 |
| Free Cash Flow (MM) | -$3 | $1,078 | $2,786 | $5,015 | $7,566 | $3,714 |
| Capital Expenditures (MM) | $2,101 | $1,327 | $3,157 | $6,482 | $7,158 | $8,450 |
| Current Ratio | 0.83 | 1.13 | 1.88 | 1.38 | 1.53 | 1.69 |
| Total Debt (MM) | $13,992 | $14,501 | $13,112 | $9,861 | $7,511 | $9,024 |
| Net Debt / EBITDA | 14.27 | 6.33 | -1.76 | -0.91 | -0.54 | -0.46 |
Tesla has growing revenues and increasing reinvestment in the business and exceptional EPS growth. Additionally, the company's financial statements display low leverage and irregular cash flows. Furthermore, Tesla has average net margins with a positive growth rate.
Tesla's P/B and P/E Ratios Are Higher Than Average:
Tesla has a trailing twelve month P/E ratio of 75.4, compared to an average of 22.96 for the Consumer Discretionary sector. Based on its EPS guidance of $3.84, the company has a forward P/E ratio of 60.9. According to the 69.0% compound average growth rate of Tesla's historical and projected earnings per share, the company's PEG ratio is 1.09. Taking the weighted average of the company's EPS CAGR and the broader market's 5-year projected EPS growth rate, we obtain a normalized growth rate of 11.5%. On this basis, the company's PEG ratio is 6.57. This suggests that these shares are overvalued. Furthermore, Tesla is likely overvalued compared to the book value of its equity, since its P/B ratio of 14.23 is higher than the sector average of 4.24. The company's shares are currently trading 612.6% above their Graham number. Overall, Tesla's lofty valuation in terms of earnings and assets is to some extent attenuated by its strong cash flow trend and reasonable levels of debt.
Tesla Has an Average Rating of Hold:
The 38 analysts following Tesla have set target prices ranging from $24.33 to $380.0 per share, for an average of $223.98 with a hold rating. As of April 2023, the company is trading 4.4% away from its average target price, indicating that there is an analyst consensus of little upside potential.
Tesla has an average amount of shares sold short because 3.3% of the company's shares are sold short. Institutions own 44.7% of the company's shares, and the insider ownership rate stands at 13.02%, suggesting a large amount of insider shareholders. The largest shareholder is Vanguard Group Inc, whose 7% stake in the company is worth $54,065,183,715.