Williams Companies logged a 0.7% change during today's afternoon session, and is now trading at a price of $34.66 per share.
Over the last year, Williams Companies logged a 2.0% change, with its stock price reaching a high of $37.45 and a low of $27.8. Over the same period, the stock underperformed the S&P 500 index by -14.2%. As of April 2023, the company's 50-day average price was $35.19. The Williams Companies, Inc., together with its subsidiaries, operates as an energy infrastructure company primarily in the United States. Based in Tulsa, OK, the large-cap Utilities company has 5,043 full time employees. Williams Companies has offered a 5.1% dividend yield over the last 12 months.
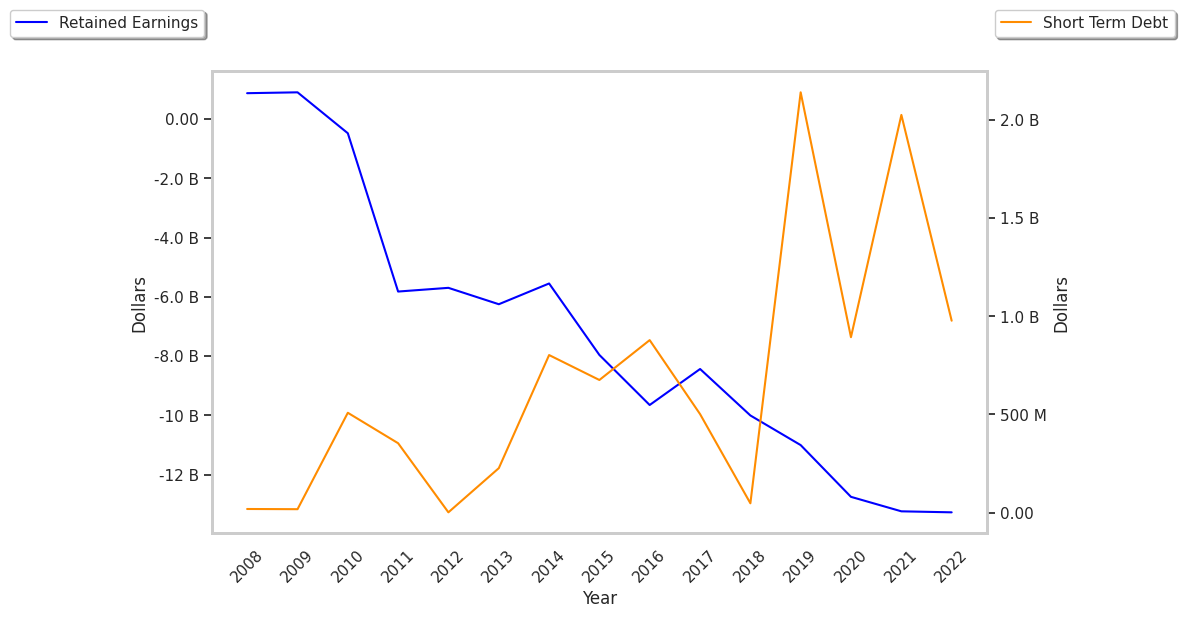
The Company May Be Profitable, but Its Balance Sheet Is Highly Leveraged:
| 2018 | 2019 | 2020 | 2021 | 2022 | 2023 | |
|---|---|---|---|---|---|---|
| Revenue (MM) | $8,686 | $8,201 | $7,719 | $10,627 | $10,965 | $11,053 |
| Revenue Growth | n/a | -5.58% | -5.88% | 37.67% | 3.18% | 0.8% |
| Operating Margins | 9% | 23% | 28% | 25% | 28% | 39% |
| Net Margins | 4% | 10% | 3% | 15% | 19% | 26% |
| Net Income (MM) | $348 | $850 | $211 | $1,562 | $2,117 | $2,832 |
| Net Interest Expense (MM) | $1,160 | $1,218 | $1,192 | $1,190 | $1,167 | $1,249 |
| Depreciation & Amort. (MM) | $1,725 | $1,714 | $1,721 | $1,842 | $2,009 | $2,047 |
| Earnings Per Share | -$0.16 | $0.7 | $0.17 | $1.24 | $1.67 | $2.22 |
| EPS Growth | n/a | 537.5% | -75.71% | 629.41% | 34.68% | 32.93% |
| Diluted Shares (MM) | 974 | 1,214 | 1,215 | 1,218 | 1,223 | 1,222 |
| Free Cash Flow (MM) | $37 | $1,584 | $2,257 | $2,706 | $2,636 | $2,693 |
| Capital Expenditures (MM) | $3,256 | $2,109 | $1,239 | $1,239 | $2,253 | $2,651 |
| Current Ratio | 0.81 | 0.4 | 0.62 | 0.91 | 0.78 | 0.77 |
| Total Debt (MM) | $22,414 | $22,288 | $22,344 | $23,675 | $22,904 | $23,346 |
| Net Debt / EBITDA | 8.92 | 6.05 | 5.66 | 4.92 | 4.53 | 3.35 |
Williams Companies has growing revenues and a flat capital expenditure trend and exceptional EPS growth. Additionally, the company's financial statements display decent operating margins with a positive growth rate and irregular cash flows. However, the firm has a highly leveraged balance sheet.
A Very Low P/E Ratio but Trades Above Its Graham Number:
Williams Companies has a trailing twelve month P/E ratio of 15.4, compared to an average of 17.53 for the Utilities sector. Based on its EPS guidance of $1.88, the company has a forward P/E ratio of 18.7. According to the 43.9% compound average growth rate of Williams Companies's historical and projected earnings per share, the company's PEG ratio is 0.35. Taking the weighted average of the company's EPS CAGR and the broader market's 5-year projected EPS growth rate, we obtain a normalized growth rate of 11.2%. On this basis, the company's PEG ratio is 1.38. This implies that the shares are fairly valued. In contrast, Williams Companies is likely overvalued compared to the book value of its equity, since its P/B ratio of 3.57 is higher than the sector average of 1.71. The company's shares are currently trading 57.2% above their Graham number. Ultimately, Williams Companies's strong cash flows, decent earnings multiple, and healthy debt levels factor towards it being fairly valued, its elevated P/B ratio notwithstanding.
Williams Companies Has an Average Rating of Buy:
The 20 analysts following Williams Companies have set target prices ranging from $34.0 to $43.0 per share, for an average of $38.55 with a buy rating. As of April 2023, the company is trading -8.7% away from its average target price, indicating that there is an analyst consensus of some upside potential.
Williams Companies has an average amount of shares sold short because 2.2% of the company's shares are sold short. Institutions own 88.5% of the company's shares, and the insider ownership rate stands at 0.35%, suggesting a small amount of insider investors. The largest shareholder is Vanguard Group Inc, whose 11% stake in the company is worth $4,443,338,977.