Halozyme Therapeutics logged a -6.3% change during today's evening session, and is now trading at a price of $39.45 per share.
Halozyme Therapeutics returned losses of -26.2% last year, with its stock price reaching a high of $58.65 and a low of $29.85. Over the same period, the stock underperformed the S&P 500 index by -47.0%. As of April 2023, the company's 50-day average price was $37.64. Halozyme Therapeutics, Inc., a biopharma technology platform company, researches, develops, and commercializes proprietary enzymes and devices in the United States, Switzerland, Ireland, Belgium, Japan, and internationally. Based in San Diego, CA, the mid-cap Health Care company has 393 full time employees. Halozyme Therapeutics has not offered a dividend during the last year.
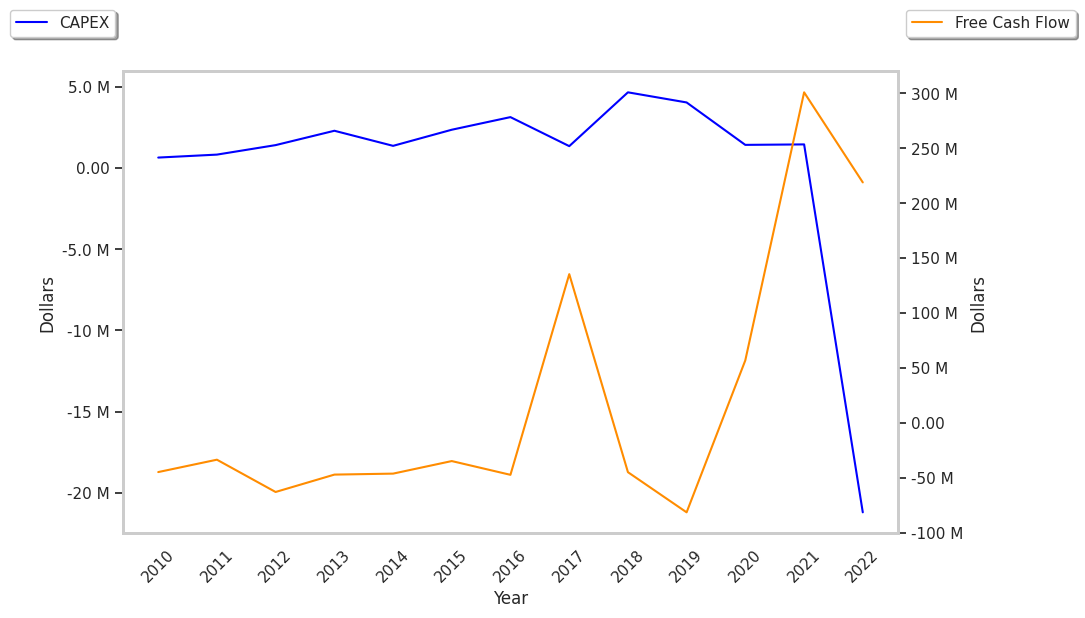
Growing Revenues With Increasing Reinvestment in the Business:
| 2018 | 2019 | 2020 | 2021 | 2022 | 2023 | |
|---|---|---|---|---|---|---|
| Revenue (k) | $151,862 | $195,992 | $267,594 | $443,310 | $660,116 | $780,710 |
| Revenue Growth | n/a | 29.06% | 36.53% | 65.67% | 48.91% | 18.27% |
| Operating Margins | -46% | -34% | 54% | 62% | 41% | 41% |
| Net Margins | -53% | -37% | 48% | 91% | 31% | 33% |
| Net Income (k) | -$80,330 | -$72,240 | $129,085 | $402,710 | $202,129 | $253,908 |
| Net Interest Expense (k) | $18,041 | $11,627 | $20,378 | $7,526 | $16,947 | $18,112 |
| Depreciation & Amort. (k) | $2,388 | $4,068 | $3,284 | $2,997 | $43,148 | $60,563 |
| Earnings Per Share | -$0.56 | -$0.5 | $0.91 | $2.74 | $1.44 | $1.87 |
| Free Cash Flow (k) | -$54,163 | -$89,463 | $52,950 | $297,983 | $235,300 | $353,628 |
| Capital Expenditures | $4,663 | $4,040 | $2,504 | $1,457 | $4,810 | $15,042 |
| Current Ratio | 2.86 | 6.35 | 1.32 | 7.91 | 5.65 | 7.63 |
| Total Debt (k) | $126,380 | $402,587 | $397,228 | $876,674 | $1,519,434 | $1,497,621 |
| Net Debt / EBITDA | -1.02 | -4.44 | 1.69 | 2.72 | 4.14 | 3.23 |
Halozyme Therapeutics has growing revenues and increasing reinvestment in the business and exceptional EPS growth. Additionally, the company's financial statements display decent operating margins with a positive growth rate and irregular cash flows. Furthermore, Halozyme Therapeutics has significant leverage.
A Lower P/E Ratio Than Its Sector Average but Trades Above Its Graham Number:
Halozyme Therapeutics has a trailing twelve month P/E ratio of 20.1, compared to an average of 30.21 for the Health Care sector. Based on its EPS guidance of $4.34, the company has a forward P/E ratio of 8.7. According to the 36.3% compound average growth rate of Halozyme Therapeutics's historical and projected earnings per share, the company's PEG ratio is 0.55. Taking the weighted average of the company's EPS CAGR and the broader market's 5-year projected EPS growth rate, we obtain a normalized growth rate of 11.0%. On this basis, the company's PEG ratio is 1.83. This suggests that these shares are overvalued. Furthermore, Halozyme Therapeutics is likely overvalued compared to the book value of its equity, since its P/B ratio of 20.91 is higher than the sector average of 4.08. The company's shares are currently trading 323.3% above their Graham number. Ultimately, Halozyme Therapeutics's strong cash flows, decent earnings multiple, and healthy debt levels factor towards it being fairly valued, its elevated P/B ratio notwithstanding.
Analysts Give Halozyme Therapeutics an Average Rating of Buy:
The 11 analysts following Halozyme Therapeutics have set target prices ranging from $28.0 to $72.0 per share, for an average of $51.27 with a buy rating. As of April 2023, the company is trading -26.6% away from its average target price, indicating that there is an analyst consensus of strong upside potential.
Halozyme Therapeutics has an average amount of shares sold short because 6.4% of the company's shares are sold short. Institutions own 95.3% of the company's shares, and the insider ownership rate stands at 0.99%, suggesting a small amount of insider investors. The largest shareholder is Blackrock Inc., whose 14% stake in the company is worth $714,779,375.