Now trading at a price of $168.25, PepsiCo has moved -2.2% so far today.
Over the last year, PepsiCo logged a -4.6% change, with its stock price reaching a high of $196.88 and a low of $155.83. Over the same period, the stock underperformed the S&P 500 index by -25.4%. As of April 2023, the company's 50-day average price was $165.23. PepsiCo, Inc. manufactures, markets, distributes, and sells various beverages and convenient foods worldwide. Based in Purchase, NY, the large-cap Consumer Staples company has 315,000 full time employees. PepsiCo has offered a 2.8% dividend yield over the last 12 months.
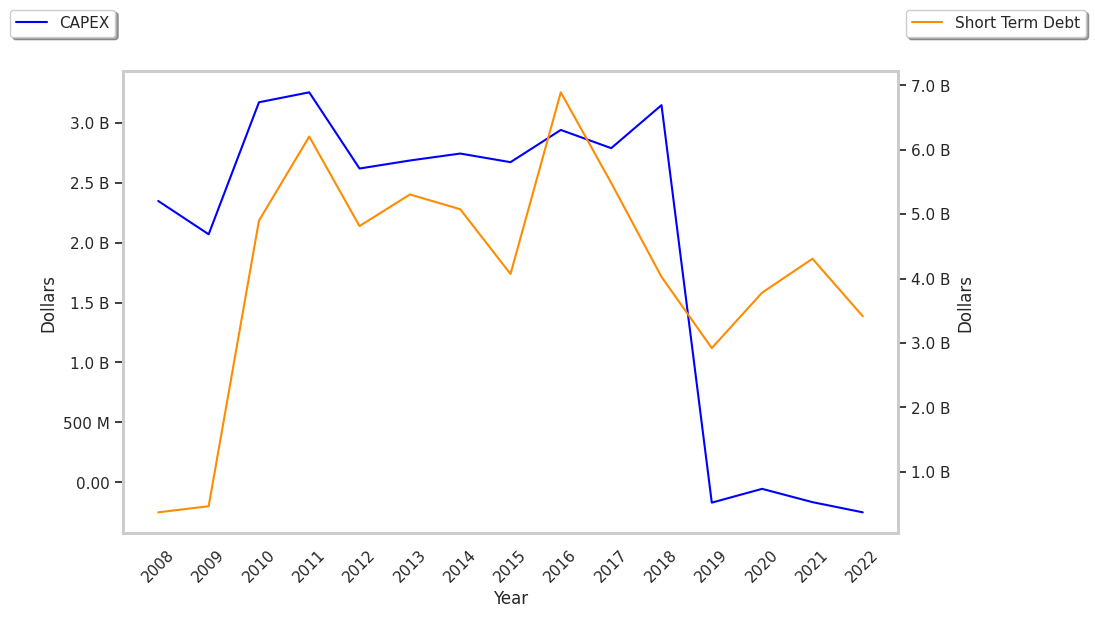
Growing Revenues With Increasing Reinvestment in the Business:
| 2018 | 2019 | 2020 | 2021 | 2022 | 2023 | |
|---|---|---|---|---|---|---|
| Revenue (MM) | $64,661 | $67,161 | $70,372 | $79,474 | $86,392 | $149,564 |
| Revenue Growth | n/a | 3.87% | 4.78% | 12.93% | 8.7% | 73.12% |
| Operating Margins | 16% | 15% | 14% | 14% | 13% | 16% |
| Net Margins | 19% | 11% | 10% | 10% | 10% | 12% |
| Net Income (MM) | $12,559 | $7,353 | $7,175 | $7,679 | $8,978 | $18,433 |
| Net Interest Expense (MM) | $1,219 | $935 | $1,128 | $1,863 | $939 | $1,405 |
| Depreciation & Amort. (MM) | $2,399 | $2,432 | $2,548 | $2,710 | $2,763 | $2,882 |
| Earnings Per Share | $8.78 | $5.2 | $5.12 | $5.49 | $6.42 | $13.23 |
| EPS Growth | n/a | -40.77% | -1.54% | 7.23% | 16.94% | 106.07% |
| Diluted Shares (MM) | 1,428 | 1,411 | 1,395 | 1,389 | 1,387 | 5,535 |
| Free Cash Flow (MM) | $6,133 | $5,417 | $6,373 | $6,991 | $5,604 | $6,947 |
| Capital Expenditures (MM) | $3,282 | $4,232 | $4,240 | $4,625 | $5,207 | $5,188 |
| Current Ratio | 0.99 | 0.86 | 0.98 | 0.83 | 0.8 | 0.88 |
| Total Debt (MM) | $35,992 | $34,118 | $46,542 | $43,338 | $42,590 | $48,465 |
| Net Debt / EBITDA | 2.18 | 2.25 | 3.04 | 2.72 | 2.64 | 1.42 |
PepsiCo has growing revenues and increasing reinvestment in the business, positive EPS growth, and healthy leverage. However, the firm suffers from weak operating margins with a stable trend and irregular cash flows.
PepsiCo's P/B and P/E Ratios Are Higher Than Average:
PepsiCo has a trailing twelve month P/E ratio of 27.5, compared to an average of 21.21 for the Consumer Staples sector. Based on its EPS guidance of $7.55, the company has a forward P/E ratio of 21.9. The -2.1% compound average growth rate of PepsiCo's historical and projected earnings per share yields a PEG ratio of -12.91. This indicates that its shares are overvalued.Furthermore, PepsiCo is likely overvalued compared to the book value of its equity, since its P/B ratio of 12.3 is higher than the sector average of 4.12. The company's shares are currently trading 428.1% above their Graham number.
Analysts Give PepsiCo an Average Rating of Buy:
The 20 analysts following PepsiCo have set target prices ranging from $139.83 to $203.73 per share, for an average of $173.96 with a buy rating. As of April 2023, the company is trading -5.0% away from its average target price, indicating that there is an analyst consensus of some upside potential.
PepsiCo has a very low short interest because 1.1% of the company's shares are sold short. Institutions own 76.5% of the company's shares, and the insider ownership rate stands at 0.15%, suggesting a small amount of insider investors. The largest shareholder is Vanguard Group Inc, whose 9% stake in the company is worth $22,076,673,057.