Agilent Technologies logged a 0.1% change during today's morning session, and is now trading at a price of $138.06 per share.
Agilent Technologies returned losses of -7.6% last year, with its stock price reaching a high of $159.59 and a low of $96.8. Over the same period, the stock underperformed the S&P 500 index by -30.1%. As of April 2023, the company's 50-day average price was $115.46. Agilent Technologies, Inc. provides application focused solutions to the life sciences, diagnostics, and applied chemical markets worldwide. Based in Santa Clara, CA, the large-cap Industrials company has 18,000 full time employees. Agilent Technologies has offered a 0.7% dividend yield over the last 12 months.
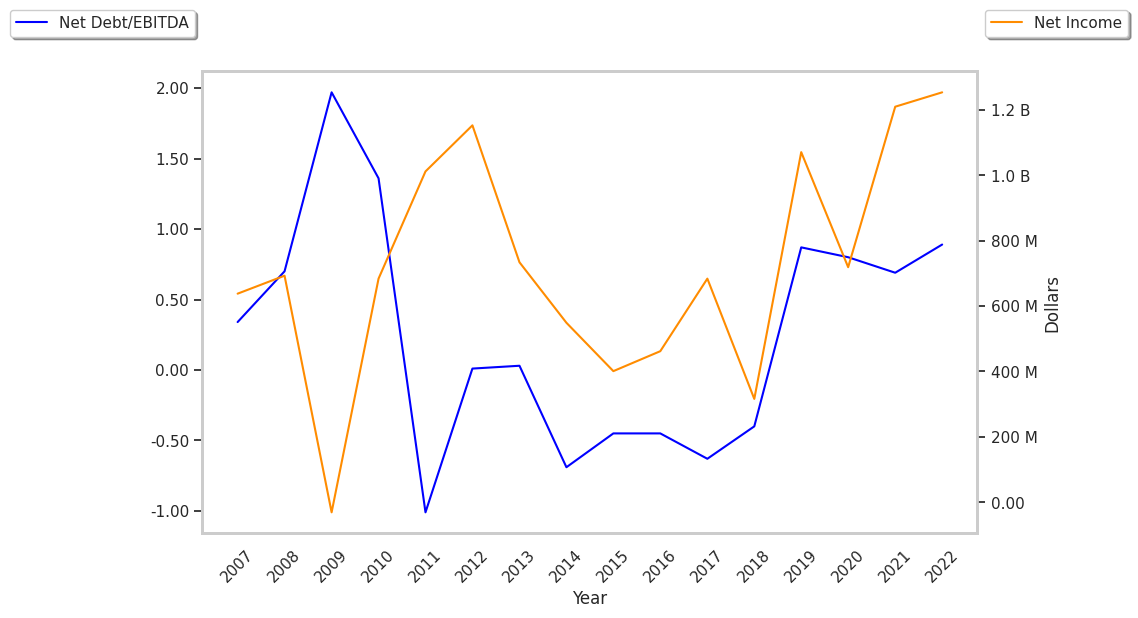
Growing Revenues With Increasing Reinvestment in the Business:
| 2018 | 2019 | 2020 | 2021 | 2022 | 2023 | |
|---|---|---|---|---|---|---|
| Revenue (MM) | $4,914 | $5,163 | $5,339 | $6,319 | $6,848 | $6,994 |
| Revenue Growth | n/a | 5.07% | 3.41% | 18.36% | 8.37% | 2.13% |
| Operating Margins | 19% | 18% | 16% | 22% | 24% | 20% |
| Net Interest Expense (MM) | $79 | $74 | $78 | $92 | $84 | $96 |
| Depreciation & Amort. (MM) | $210 | $238 | $308 | $321 | $317 | $282 |
| Earnings Per Share | $0.97 | $3.37 | $2.3 | $3.94 | $4.18 | $3.83 |
| EPS Growth | n/a | 247.42% | -31.75% | 71.3% | 6.09% | -8.37% |
| Diluted Shares (MM) | 325 | 318 | 312 | 307 | 300 | 286 |
| Free Cash Flow (MM) | $910 | $866 | $802 | $1,297 | $1,021 | $1,420 |
| Capital Expenditures (MM) | $177 | $155 | $119 | $188 | $291 | $284 |
| Current Ratio | 3.33 | 1.53 | 2.33 | 2.22 | 2.03 | 2.29 |
| Total Debt (MM) | $1,831 | $2,407 | $2,359 | $2,729 | $2,769 | $2,789 |
| Net Debt / EBITDA | -0.36 | 0.87 | 0.8 | 0.74 | 0.89 | 0.86 |
Agilent Technologies has growing revenues and increasing reinvestment in the business and exceptional EPS growth. Additionally, the company's financial statements display low leverage and irregular cash flows. However, the firm has weak operating margins with a stable trend.
The Market May Be Overvaluing Agilent Technologies's Earnings and Assets:
Agilent Technologies has a trailing twelve month P/E ratio of 27.6, compared to an average of 22.19 for the Industrials sector. Based on its EPS guidance of $6.05, the company has a forward P/E ratio of 19.1. According to the 29.9% compound average growth rate of Agilent Technologies's historical and projected earnings per share, the company's PEG ratio is 0.92. Taking the weighted average of the company's EPS CAGR and the broader market's 5-year projected EPS growth rate, we obtain a normalized growth rate of 10.8%. On this basis, the company's PEG ratio is 2.55. This suggests that these shares are overvalued. Furthermore, Agilent Technologies is likely overvalued compared to the book value of its equity, since its P/B ratio of 6.9 is higher than the sector average of 4.06. The company's shares are currently trading 237.8% above their Graham number. Overall, Agilent Technologies's lofty valuation in terms of earnings and assets is to some extent attenuated by its strong cash flow trend and reasonable levels of debt.
There's an Analyst Consensus of Little Upside Potential for Agilent Technologies:
The 17 analysts following Agilent Technologies have set target prices ranging from $100.0 to $150.0 per share, for an average of $131.94 with a buy rating. As of April 2023, the company is trading -12.5% away from its average target price, indicating that there is an analyst consensus of little upside potential.
Agilent Technologies has an average amount of shares sold short because 2.3% of the company's shares are sold short. Institutions own 89.7% of the company's shares, and the insider ownership rate stands at 0.31%, suggesting a small amount of insider investors. The largest shareholder is Blackrock Inc., whose 10% stake in the company is worth $3,867,801,637.