Today we're going to take a closer look at large-cap Energy company Valero Energy, whose shares are currently trading at $128.49. We've been asking ourselves whether the company is under or over valued at today's prices... let's perform a brief value analysis to find out!
Valero Energy Is Reasonably Priced:
Valero Energy Corporation manufactures, markets, and sells transportation fuels and petrochemical products in the United States, Canada, the United Kingdom, Ireland, Latin America, and internationally. The company belongs to the Energy sector, which has an average price to earnings (P/E) ratio of 8.53 and an average price to book (P/B) ratio of 1.78. In contrast, Valero Energy has a trailing 12 month P/E ratio of 4.4 and a P/B ratio of 1.68.
When we divide Valero Energy's P/E ratio by its expected EPS growth rate of the next five years, we obtain its PEG ratio of -0.24. Since it's negative, the company has negative growth expectations, and most investors will probably avoid the stock unless it has an exceptionally low P/E and P/B ratio.
Exceptional EPS Growth at the Expense of a Highly Leveraged Balance Sheet:
| 2018 | 2019 | 2020 | 2021 | 2022 | 2023 | |
|---|---|---|---|---|---|---|
| Revenue (MM) | $117,033 | $108,324 | $64,912 | $113,977 | $176,383 | $151,098 |
| Revenue Growth | n/a | -7.44% | -40.08% | 75.59% | 54.75% | -14.34% |
| Operating Margins | 4% | 4% | -2% | 2% | 9% | 10% |
| Net Margins | 3% | 3% | 0% | 1% | 7% | 7% |
| Net Income (MM) | $3,353 | $2,784 | $314 | $1,288 | $11,879 | $11,163 |
| Net Interest Expense (MM) | $470 | $454 | $563 | $603 | $562 | $580 |
| Depreciation & Amort. (MM) | $2,017 | $2,255 | $2,351 | $2,405 | $2,473 | $2,644 |
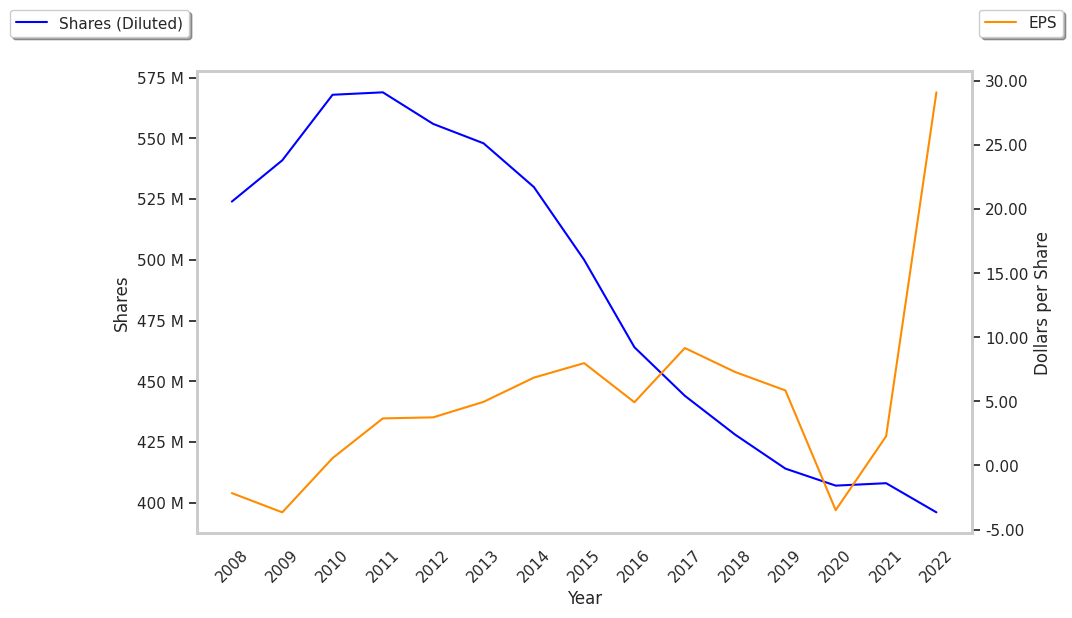
| Earnings Per Share | $7.29 | $5.84 | -$3.5 | $2.27 | $29.04 | $29.25 |
| EPS Growth | n/a | -19.89% | -159.93% | 164.86% | 1179.3% | 0.72% |
| Diluted Shares (MM) | 428 | 414 | 407 | 407 | 396 | 270 |
| Free Cash Flow (MM) | $3,018 | $4,616 | $948 | $5,859 | $12,574 | $12,086 |
| Current Ratio | 1.65 | 1.44 | 1.71 | 1.26 | 1.38 | 1.51 |
| Total Debt (MM) | $9,595 | $9,672 | $15,090 | $13,870 | $11,635 | $11,441 |
| Net Debt / EBITDA | 1.0 | 1.16 | 15.26 | 2.15 | 0.37 | 0.33 |
Valero Energy has growing revenues and no capital expenditures, exceptional EPS growth, and irregular cash flows. However, the firm suffers from weak operating margins with a positive growth rate and a highly leveraged balance sheet.