We've been asking ourselves recently if the market has placed a fair valuation on Micron Technology. Let's dive into some of the fundamental values of this large-cap Technology company to determine if there might be an opportunity here for value-minded investors.
Micron Technology Has an Attractive P/B Ratio but a Worrisome P/E Ratio:
Micron Technology, Inc. designs, develops, manufactures, and sells memory and storage products worldwide. The company belongs to the Technology sector, which has an average price to earnings (P/E) ratio of 35.0 and an average price to book (P/B) ratio of 7.92. In contrast, Micron Technology has a trailing 12 month P/E ratio of -15.2 and a P/B ratio of 2.03.
Micron Technology's PEG ratio is 25.93, which shows that the stock is probably overvalued in terms of its estimated growth. For reference, a PEG ratio near or below 1 is a potential signal that a company is undervalued.
The Business Is Unprofitable and Its Balance Sheet Is Highly Leveraged:
| 2018 | 2019 | 2020 | 2021 | 2022 | 2023 | |
|---|---|---|---|---|---|---|
| Revenue (MM) | $30,391 | $23,406 | $21,435 | $27,705 | $30,758 | $15,540 |
| Revenue Growth | n/a | -22.98% | -8.42% | 29.25% | 11.02% | -49.48% |
| Operating Margins | 49% | 32% | 14% | 23% | 32% | -36% |
| Net Margins | 47% | 27% | 13% | 21% | 28% | 56% |
| Net Income (MM) | $14,138 | $6,358 | $2,710 | $5,861 | $8,687 | $8,687 |
| Net Interest Expense (MM) | $342 | $128 | $194 | $183 | $189 | $388 |
| Depreciation & Amort. (MM) | $4,759 | $5,424 | $5,650 | $6,214 | $7,116 | $7,756 |
| Earnings Per Share | $11.51 | $5.51 | $2.37 | $5.14 | $7.75 | -$5.34 |
| EPS Growth | n/a | -52.13% | -56.99% | 116.88% | 50.78% | -168.9% |
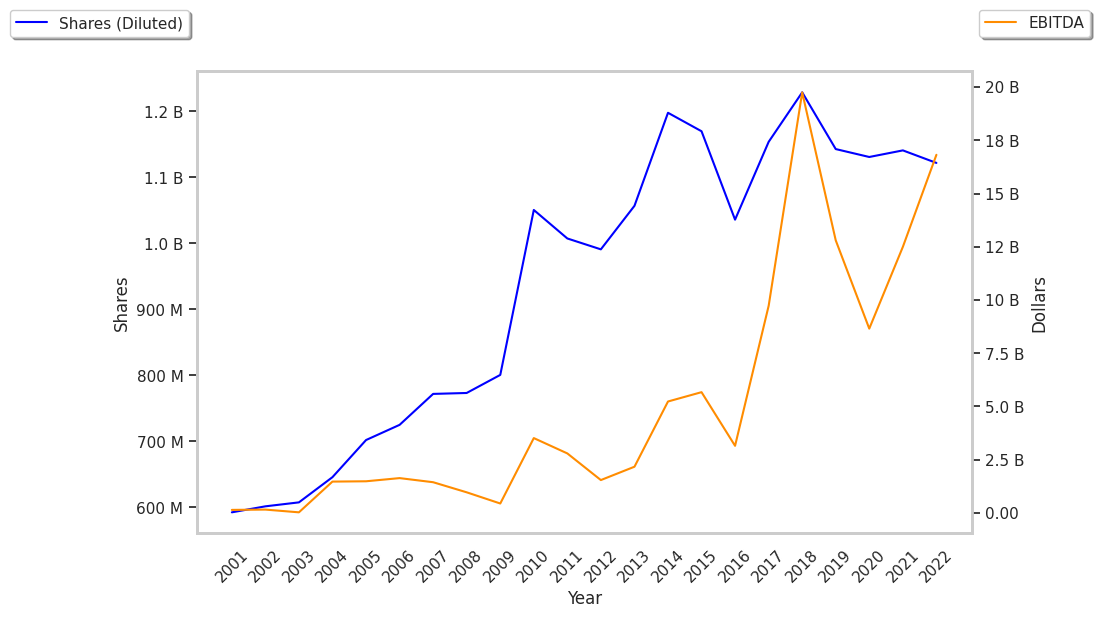
| Diluted Shares (MM) | 1,229 | 1,143 | 1,131 | 1,141 | 1,122 | 1,093 |
| Free Cash Flow (MM) | $8,521 | $3,409 | $83 | $2,438 | $3,114 | -$6,117 |
| Capital Expenditures (MM) | $8,879 | $9,780 | $8,223 | $10,030 | $12,067 | $7,676 |
| Current Ratio | 2.9 | 2.56 | 2.91 | 3.1 | 3.51 | 4.46 |
| Total Debt (MM) | $7,833 | $10,334 | $10,886 | $11,863 | $15,082 | $16,749 |
| Net Debt / EBITDA | 0.17 | 0.26 | 0.57 | 0.25 | 0.33 | 3.9 |
Micron Technology's financial statements include several red flags such as weak operating margins with a negative growth trend, declining EPS growth, and irregular cash flows. Additionally, the firm has a highly leveraged balance sheet. Micron Technology has weak revenue growth and a flat capital expenditure trend.