Verizon Communications shares fell by -1.3% during the day's evening session, and are now trading at a price of $37.37. Is it time to buy the dip? To better answer that question, it's essential to check if the market is valuing the company's shares fairly in terms of its earnings and equity levels.
Verizon Communications Has Attractive P/B and P/E Ratios:
Verizon Communications Inc., through its subsidiaries, provides communications, technology, information, and entertainment products and services to consumers, businesses, and governmental entities worldwide. The company belongs to the Telecommunications sector, which has an average price to earnings (P/E) ratio of 23.78 and an average price to book (P/B) ratio of 3.46. In contrast, Verizon Communications has a trailing 12 month P/E ratio of 7.5 and a P/B ratio of 1.61.
Verizon Communications's PEG ratio is 15.17, which shows that the stock is probably overvalued in terms of its estimated growth. For reference, a PEG ratio near or below 1 is a potential signal that a company is undervalued.
Irregular Cash Flows With a Flat Trend:
| 2018 | 2019 | 2020 | 2021 | 2022 | 2023 | |
|---|---|---|---|---|---|---|
| Revenue (MM) | $130,863 | $131,868 | $128,292 | $133,613 | $136,835 | $134,095 |
| Revenue Growth | n/a | 0.77% | -2.71% | 4.15% | 2.41% | -2.0% |
| Operating Margins | 17% | 23% | 22% | 24% | 22% | 22% |
| Net Margins | 12% | 15% | 14% | 17% | 16% | 16% |
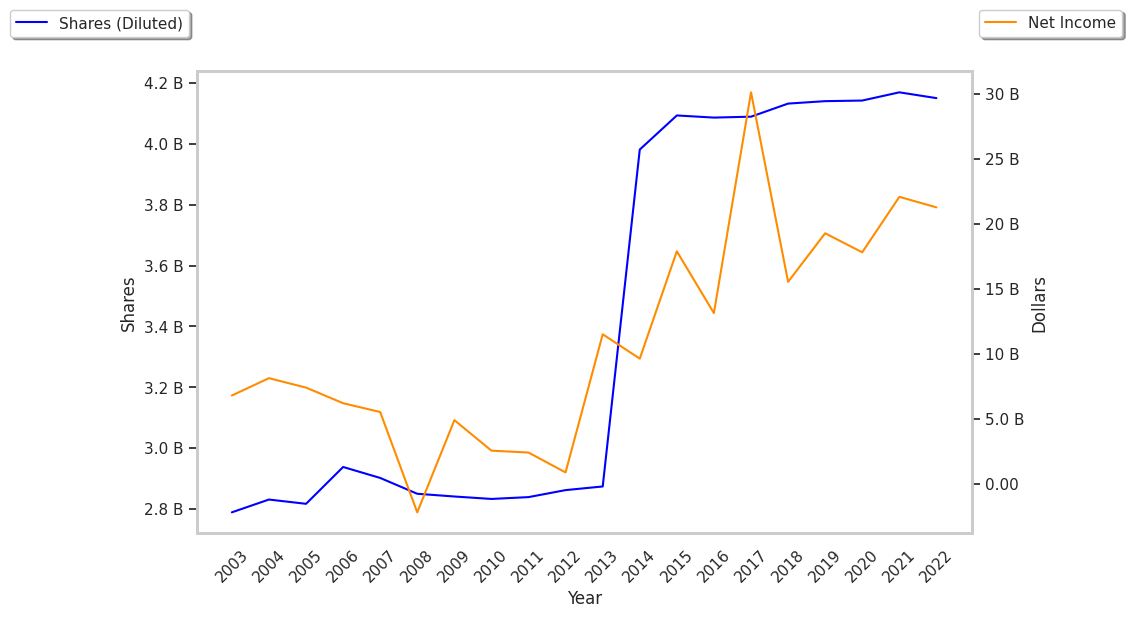
| Net Income (MM) | $16,039 | $19,788 | $18,348 | $22,618 | $21,748 | $21,366 |
| Net Interest Expense (MM) | $4,833 | $4,730 | $4,247 | $3,485 | $3,613 | $5,030 |
| Depreciation & Amort. (MM) | $17,403 | $16,682 | $16,720 | $16,206 | $17,099 | $17,326 |
| Earnings Per Share | $3.76 | $4.65 | $4.3 | $5.32 | $5.06 | $4.96 |
| EPS Growth | n/a | 23.67% | -7.53% | 23.72% | -4.89% | -1.98% |
| Diluted Shares (MM) | 4,132 | 4,140 | 4,142 | 4,150 | 4,204 | 4,236 |
| Free Cash Flow (MM) | $17,681 | $17,807 | $23,576 | $19,253 | $14,054 | $16,300 |
| Capital Expenditures (MM) | $16,658 | $17,939 | $18,192 | $20,286 | $23,087 | $21,440 |
| Current Ratio | 0.91 | 0.84 | 1.38 | 0.78 | 0.75 | 0.68 |
| Total Debt (MM) | $113,063 | $111,489 | $134,213 | $151,268 | $151,204 | $147,956 |
| Net Debt / EBITDA | 2.78 | 2.31 | 2.46 | 3.05 | 3.12 | 3.07 |