Today we're going to take a closer look at large-cap Technology company Microsoft, whose shares are currently trading at $371.7. We've been asking ourselves whether the company is under or over valued at today's prices... let's perform a brief value analysis to find out!
Microsoft's Valuation Is in Line With Its Sector Averages:
Microsoft Corporation develops and supports software, services, devices and solutions worldwide. The company belongs to the Technology sector, which has an average price to earnings (P/E) ratio of 35.0 and an average price to book (P/B) ratio of 7.92. In contrast, Microsoft has a trailing 12 month P/E ratio of 36.0 and a P/B ratio of 12.51.
Microsoft's PEG ratio is 2.54, which shows that the stock is probably overvalued in terms of its estimated growth. For reference, a PEG ratio near or below 1 is a potential signal that a company is undervalued.
Growing Revenues With Increasing Reinvestment in the Business:
| 2018 | 2019 | 2020 | 2021 | 2022 | 2023 | |
|---|---|---|---|---|---|---|
| Revenue (MM) | $110,360 | $125,843 | $143,015 | $168,088 | $198,270 | $211,915 |
| Revenue Growth | n/a | 14.03% | 13.65% | 17.53% | 17.96% | 6.88% |
| Operating Margins | 33% | 35% | 37% | 42% | 42% | 42% |
| Net Margins | 15% | 31% | 31% | 36% | 37% | 34% |
| Net Income (MM) | $16,571 | $39,240 | $44,281 | $61,271 | $72,738 | $72,361 |
| Net Interest Expense (MM) | $2,733 | $2,686 | $2,591 | $2,346 | $2,063 | $1,968 |
| Depreciation & Amort. (MM) | $7,700 | $9,700 | $10,700 | $9,300 | $12,600 | $11,000 |
| Earnings Per Share | $2.13 | $5.06 | $5.76 | $8.05 | $9.65 | $9.68 |
| EPS Growth | n/a | 137.56% | 13.83% | 39.76% | 19.88% | 0.31% |
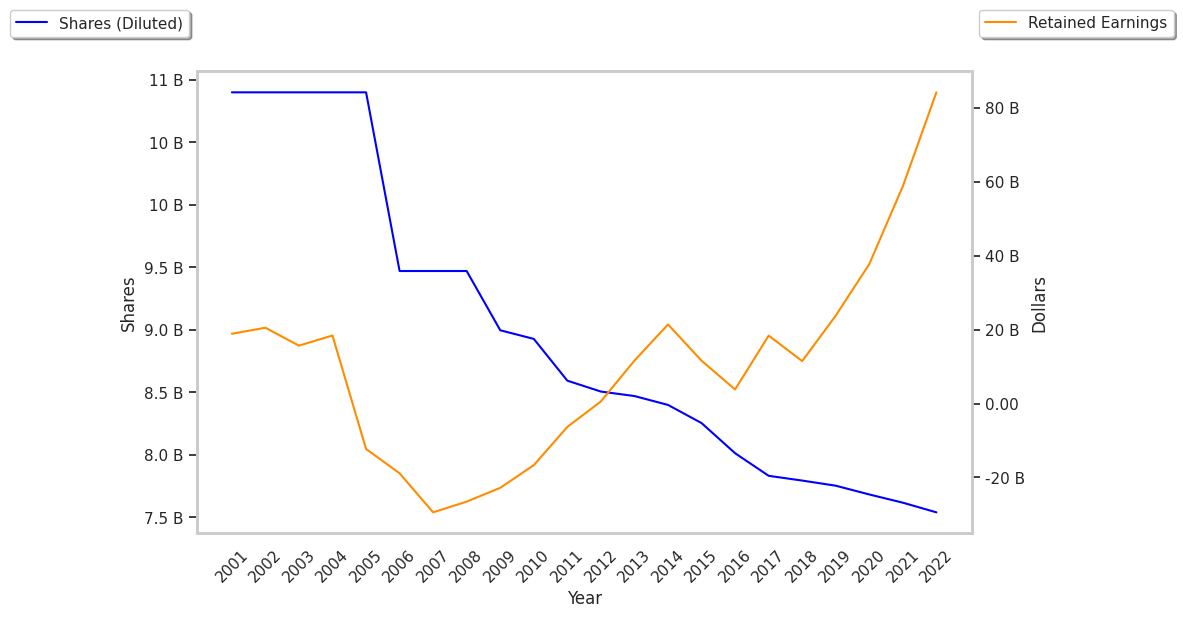
| Diluted Shares (MM) | 7,794 | 7,753 | 7,683 | 7,608 | 7,540 | 7,472 |
| Free Cash Flow (MM) | $32,252 | $38,260 | $45,234 | $56,118 | $65,149 | $59,475 |
| Capital Expenditures (MM) | $11,632 | $13,925 | $15,441 | $20,622 | $23,886 | $28,107 |
| Current Ratio | 3.12 | 2.8 | 2.58 | 2.25 | 1.93 | 1.66 |
| Total Debt (MM) | $73,169 | $69,608 | $60,523 | $53,258 | $48,116 | $71,502 |
| Net Debt / EBITDA | 1.51 | 1.14 | 0.72 | 0.41 | 0.34 | -0.09 |
Microsoft benefits from growing revenues and increasing reinvestment in the business, strong margins with a stable trend, and exceptional EPS growth. The company's financial statements show low leverage and irregular cash flows.