It's been a great evening session for Procter & Gamble Company investors, who saw their shares rise 1.5% to a price of $146.17 per share. At these higher prices, is the company still fairly valued? If you are thinking about investing, make sure to check the company's fundamentals before making a decision.
Procter & Gamble Company's Valuation Is in Line With Its Sector Averages:
The Procter & Gamble Company provides branded consumer packaged goods worldwide. The company belongs to the Consumer Discretionary sector, which has an average price to earnings (P/E) ratio of 22.96 and an average price to book (P/B) ratio of 4.24. In contrast, Procter & Gamble Company has a trailing 12 month P/E ratio of 23.7 and a P/B ratio of 7.35.
Procter & Gamble Company's PEG ratio is 3.42, which shows that the stock is probably overvalued in terms of its estimated growth. For reference, a PEG ratio near or below 1 is a potential signal that a company is undervalued.
Growing Revenues With a Flat Capital Expenditure Trend:
| 2018 | 2019 | 2020 | 2021 | 2022 | 2023 | |
|---|---|---|---|---|---|---|
| Revenue (MM) | $66,832 | $67,684 | $70,950 | $76,118 | $80,187 | $82,006 |
| Revenue Growth | n/a | 1.27% | 4.83% | 7.28% | 5.35% | 2.27% |
| Operating Margins | 20% | 8% | 22% | 24% | 22% | 22% |
| Net Margins | 15% | 6% | 18% | 19% | 18% | 18% |
| Net Income (MM) | $9,861 | $3,966 | $13,103 | $14,352 | $14,793 | $14,738 |
| Net Interest Expense (MM) | $506 | $871 | $465 | $502 | $570 | $756 |
| Depreciation & Amort. (MM) | $2,834 | $2,824 | $3,013 | $2,735 | $2,807 | $2,714 |
| Earnings Per Share | $3.67 | $1.43 | $4.96 | $5.5 | $5.81 | $5.9 |
| EPS Growth | n/a | -61.04% | 246.85% | 10.89% | 5.64% | 1.55% |
| Diluted Shares (MM) | 2,657 | 2,540 | 2,626 | 2,601 | 2,539 | 2,484 |
| Free Cash Flow (MM) | $11,150 | $11,895 | $14,330 | $15,584 | $13,567 | $13,786 |
| Capital Expenditures (MM) | $3,717 | $3,347 | $3,073 | $2,787 | $3,156 | $3,062 |
| Current Ratio | 0.78 | 0.63 | 0.78 | 0.67 | 0.56 | 0.67 |
| Total Debt (MM) | $33,627 | $28,138 | $25,381 | $28,417 | $24,197 | $24,321 |
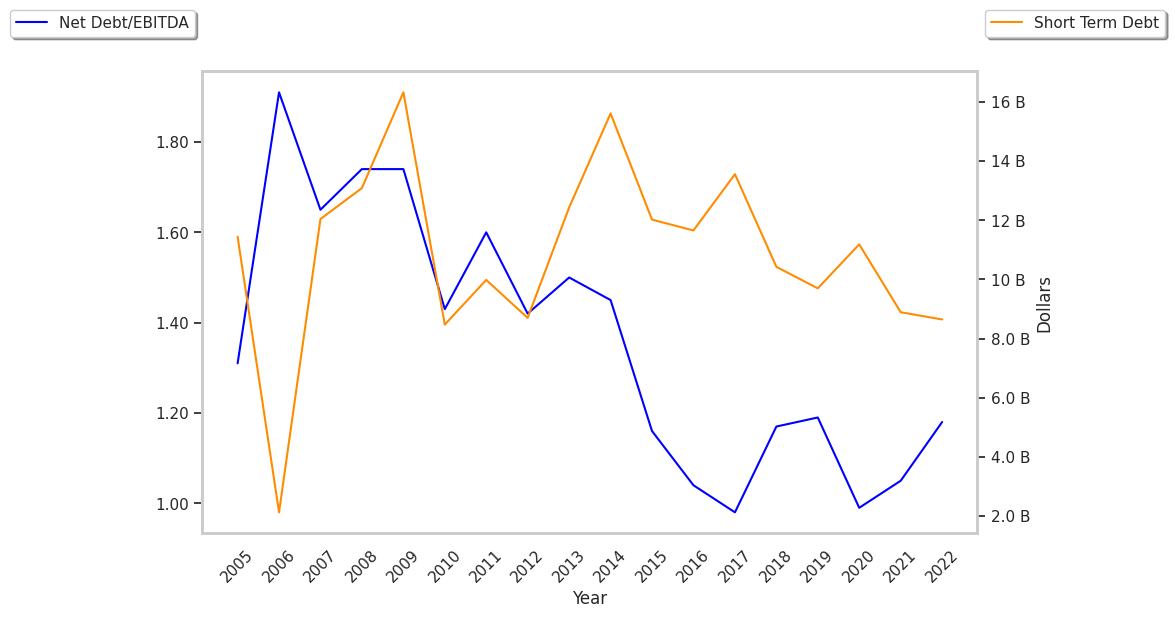
| Net Debt / EBITDA | 1.85 | 2.27 | 0.72 | 0.81 | 0.84 | 0.7 |
Procter & Gamble Company has growing revenues and a flat capital expenditure trend, low leverage, and positive EPS growth. However, the firm has irregular cash flows. Finally, we note that Procter & Gamble Company has average net margins with a stable trend.