Welltower logged a -0.7% change during today's evening session, and is now trading at a price of $90.14 per share.
Welltower returned gains of 42.5% last year, with its stock price reaching a high of $93.42 and a low of $62.62. Over the same period, the stock outperformed the S&P 500 index by 18.9%. More recently, the company's 50-day average price was $86.57. Welltower Inc. (NYSE:WELL), a real estate investment trust ("REIT") and S&P 500 company headquartered in Toledo, Ohio, is driving the transformation of health care infrastructure. Based in Toledo, OH, the large-cap Real Estate company has 514 full time employees. Welltower has offered a 2.7% dividend yield over the last 12 months.
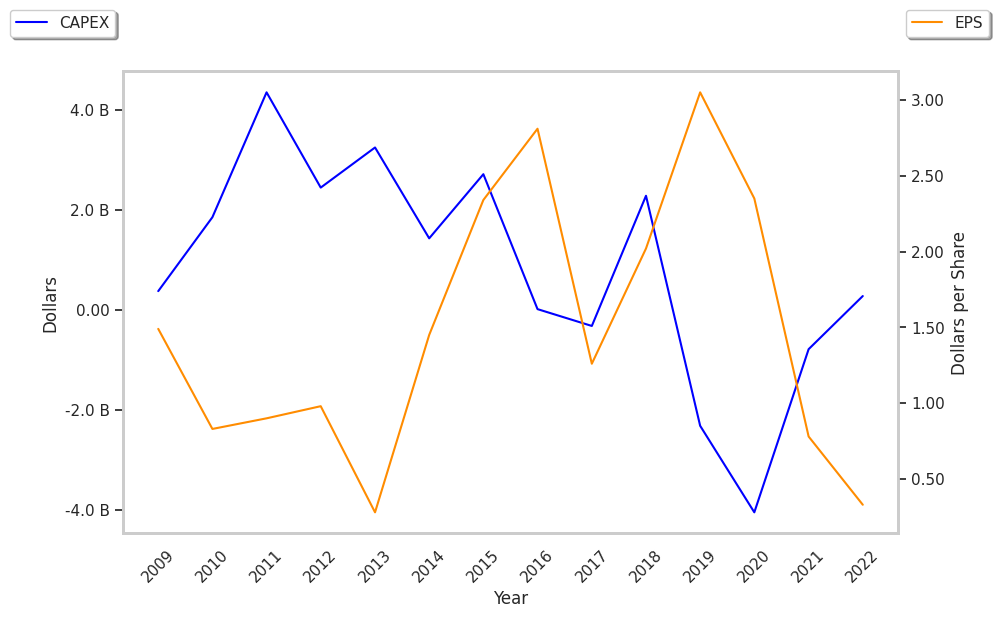
The Company Has a Highly Leveraged Balance Sheet and a Declining EPS Growth Trend:
| 2018 | 2019 | 2020 | 2021 | 2022 | 2023 | |
|---|---|---|---|---|---|---|
| Revenue (MM) | $4,700 | $5,121 | $4,606 | $4,742 | $5,861 | $6,407 |
| Revenue Growth | n/a | 8.95% | -10.06% | 2.96% | 23.59% | 9.32% |
| Operating Margins | 9% | 11% | -1% | 4% | 3% | 4% |
| Net Margins | 18% | 26% | 23% | 8% | 3% | 4% |
| Net Income (MM) | $830 | $1,330 | $1,039 | $374 | $161 | $271 |
| Net Interest Expense (MM) | $527 | $556 | $514 | $490 | $530 | $594 |
| Depreciation & Amort. (MM) | $950 | $1,027 | $1,038 | $1,038 | $1,310 | $1,363 |
| Earnings Per Share | $2.02 | $3.05 | $2.33 | $0.78 | $0.3 | $0.46 |
| EPS Growth | n/a | 50.99% | -23.61% | -66.52% | -61.54% | 53.33% |
| Diluted Shares (MM) | 375 | 404 | 417 | 427 | 465 | 617 |
| Free Cash Flow (MM) | -$1,976 | $1,207 | $1,120 | $857 | $697 | $586 |
| Capital Expenditures (MM) | $3,560 | $329 | $245 | $418 | $632 | $899 |
| Current Ratio | 97.33 | 76.51 | 12.8 | 16.56 | 22.4 | 33.41 |
| Total Debt (MM) | $14,329 | $16,385 | $14,193 | $14,644 | $14,869 | $16,185 |
| Net Debt / EBITDA | 10.27 | 10.26 | 12.56 | 11.9 | 9.6 | 8.34 |
Welltower has weak operating margins with a negative growth trend, declining EPS growth, and a highly leveraged balance sheet. On the other hand, the company benefits from growing revenues and decreasing reinvestment in the business and irregular cash flows.
Welltower's Valuation Is in Line With Its Sector Averages:
Welltower has a trailing twelve month P/E ratio of 163.3, compared to an average of 25.55 for the Real Estate sector. Based on its EPS guidance of $1.2, the company has a forward P/E ratio of 72.1. The -7.2% compound average growth rate of Welltower's historical and projected earnings per share yields a PEG ratio of -22.78. This indicates that its shares are overvalued.In contrast, the market is likely undervaluing Welltower in terms of its equity because its P/B ratio is 2.09 while the sector average is 2.1. The company's shares are currently trading 349.6% above their Graham number.
Analysts Give Welltower an Average Rating of Buy:
The 17 analysts following Welltower have set target prices ranging from $78.0 to $101.0 per share, for an average of $91.71 with a buy rating. As of April 2023, the company is trading -5.6% away from its average target price, indicating that there is an analyst consensus of some upside potential.
Welltower has a very low short interest because 1.9% of the company's shares are sold short. Institutions own 92.5% of the company's shares, and the insider ownership rate stands at 0.05%, suggesting a small amount of insider investors. The largest shareholder is Vanguard Group Inc, whose 15% stake in the company is worth $7,279,489,293.