We've been asking ourselves recently if the market has placed a fair valuation on Dominion Energy. Let's dive into some of the fundamental values of this large-cap Utilities company to determine if there might be an opportunity here for value-minded investors.
Dominion Energy's Valuation Is in Line With Its Sector Averages:
Dominion Energy, Inc. produces and distributes energy in the United States. The company belongs to the Utilities sector, which has an average price to earnings (P/E) ratio of 17.53 and an average price to book (P/B) ratio of 1.71. In contrast, Dominion Energy has a trailing 12 month P/E ratio of 16.0 and a P/B ratio of 1.53.
When we divide Dominion Energy's P/E ratio by its expected EPS growth rate of the next five years, we obtain its PEG ratio of -3.28. Since it's negative, the company has negative growth expectations, and most investors will probably avoid the stock unless it has an exceptionally low P/E and P/B ratio.
The Company Has a Highly Leveraged Balance Sheet and a Declining EPS Growth Trend:
| 2018 | 2019 | 2020 | 2021 | 2022 | 2023 | |
|---|---|---|---|---|---|---|
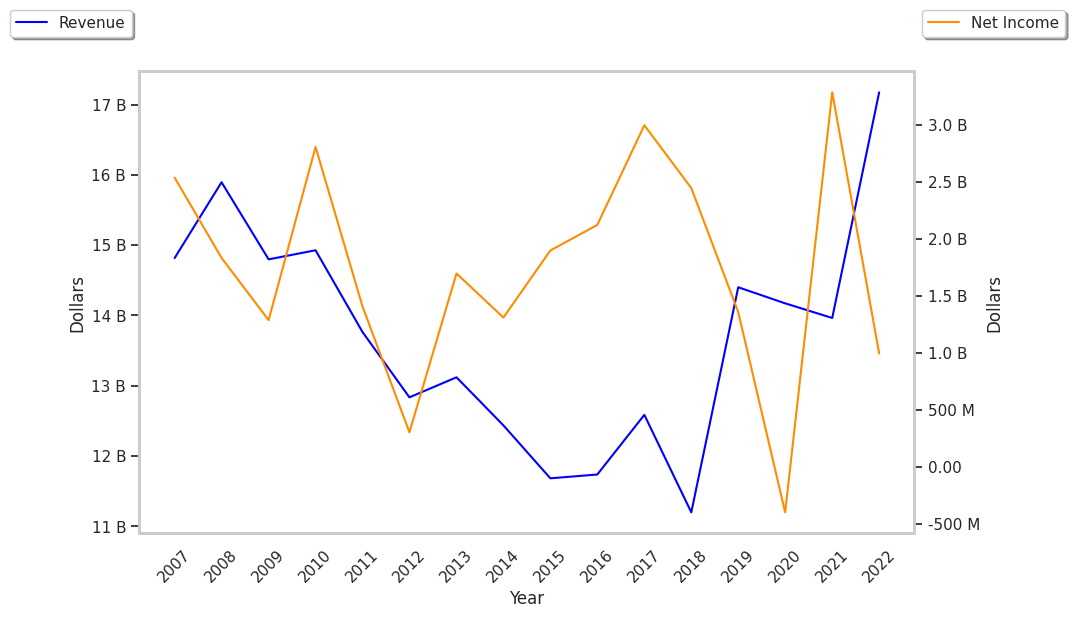
| Revenue (MM) | $11,199 | $14,401 | $11,919 | $11,420 | $13,945 | $14,669 |
| Revenue Growth | n/a | 28.59% | -17.23% | -4.19% | 22.11% | 5.19% |
| Operating Margins | 28% | 12% | 12% | 20% | 6% | 16% |
| Net Margins | 23% | 10% | 9% | 28% | 7% | 12% |
| Net Income (MM) | $2,549 | $1,376 | $1,039 | $3,314 | $994 | $1,717 |
| Net Interest Expense (MM) | $1,279 | $1,486 | $1,339 | $1,255 | $1,002 | $1,395 |
| Depreciation & Amort. (MM) | $1,660 | $2,283 | $1,991 | $2,103 | $2,442 | $2,494 |
| Earnings Per Share | $3.74 | $1.62 | -$0.57 | $3.98 | $1.09 | $1.96 |
| EPS Growth | n/a | -56.68% | -135.19% | 798.25% | -72.61% | 79.82% |
| Diluted Shares (MM) | 655 | 809 | 831 | 808 | 824 | 869 |
| Free Cash Flow (MM) | $519 | $224 | $247 | $2,575 | $3,700 | $6,215 |
| Current Ratio | 0.67 | 0.61 | 0.64 | 0.84 | 0.73 | 1.14 |
| Total Debt (MM) | $32,834 | $30,499 | $37,046 | $37,035 | $41,390 | $50,654 |
| Net Debt / EBITDA | 6.8 | 7.57 | 10.87 | 8.33 | 12.86 | 10.52 |