It's been a great afternoon session for GSI Technology investors, who saw their shares rise 1.1% to a price of $2.71 per share. At these higher prices, is the company still fairly valued? If you are thinking about investing, make sure to check the company's fundamentals before making a decision.
GSI Technology Has an Attractive P/B Ratio but a Worrisome P/E Ratio:
GSI Technology, Inc. designs, develops, and markets semiconductor memory solutions to networking, industrial, medical, aerospace, and military customers in the United States, China, Singapore, Germany, the Netherlands, and internationally. The company belongs to the Technology sector, which has an average price to earnings (P/E) ratio of 35.0 and an average price to book (P/B) ratio of 7.92. In contrast, GSI Technology has a trailing 12 month P/E ratio of -3.7 and a P/B ratio of 1.51.
GSI Technology has moved 57.6% over the last year compared to 24.0% for the S&P 500 — a difference of 33.6%. GSI Technology has a 52 week high of $9.8 and a 52 week low of $1.45.
The Company's Revenues Are Declining:
| 2018 | 2019 | 2020 | 2021 | 2022 | 2023 | |
|---|---|---|---|---|---|---|
| Revenue (k) | $42,643 | $51,486 | $43,343 | $27,729 | $33,384 | $29,691 |
| Revenue Growth | n/a | 20.74% | -15.82% | -36.02% | 20.39% | -11.06% |
| Operating Margins | -10% | 1% | -23% | -76% | -49% | -53% |
| Net Margins | -11% | 0% | -24% | -78% | -49% | -54% |
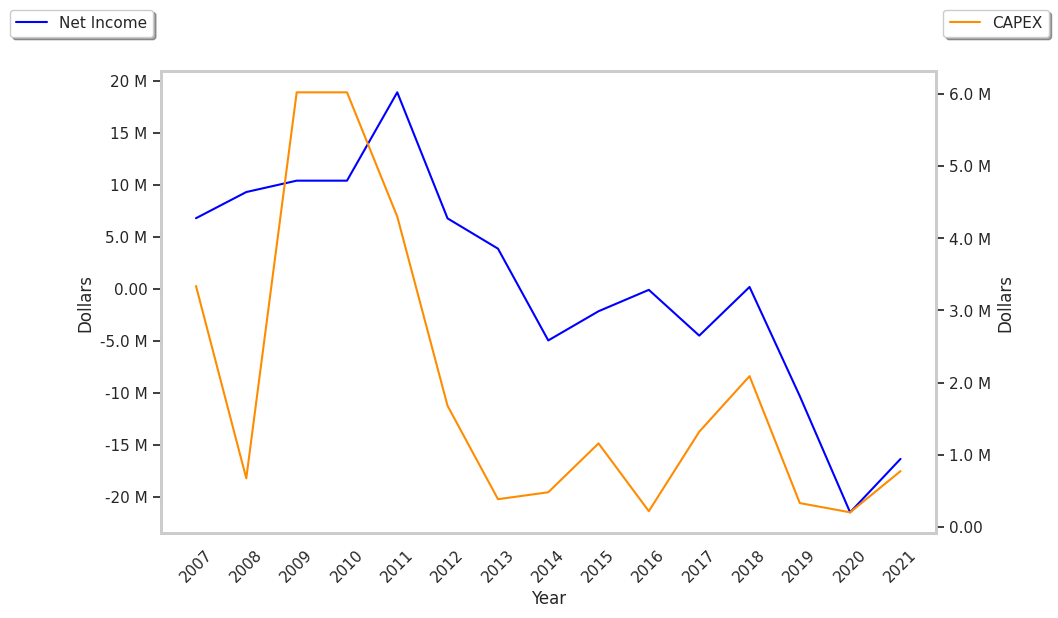
| Net Income (k) | -$4,515 | $163 | -$10,337 | -$21,505 | -$16,368 | -$15,977 |
| Net Interest Expense (k) | -$12 | -$221 | -$71 | -$71 | -$131 | -$106 |
| Depreciation & Amort. (k) | $1,255 | $1,454 | $1,434 | $1,214 | $1,004 | $1,015 |
| Earnings Per Share | -$0.21 | $0.01 | -$0.45 | -$0.91 | -$0.67 | -$0.65 |
| EPS Growth | n/a | 104.76% | -4600.0% | -102.22% | 26.37% | 2.99% |
| Diluted Shares (k) | 21,085 | 23,349 | 22,968 | 23,671 | 24,303 | 24,595 |
| Free Cash Flow (k) | -$2,765 | $916 | -$5,012 | -$15,455 | -$14,600 | -$17,409 |
| Capital Expenditures | $4,818 | $2,090 | $331 | $203 | $774 | $564 |
| Current Ratio | 8.98 | 8.96 | 7.47 | 6.99 | 6.49 | 5.5 |
GSI Technology has declining revenues and decreasing reinvestment in the business, consistently negative margins with a negative growth trend, and declining EPS growth. On the other hand, the company has healthy debt levels working in its favor.