Today we're going to take a closer look at large-cap Industrials company Honeywell International, whose shares are currently trading at $204.54. We've been asking ourselves whether the company is under or over valued at today's prices... let's perform a brief value analysis to find out!
Honeywell International's Valuation Is in Line With Its Sector Averages:
Honeywell International Inc. operates as a diversified technology and manufacturing company worldwide. The company belongs to the Industrials sector, which has an average price to earnings (P/E) ratio of 22.19 and an average price to book (P/B) ratio of 4.06. In contrast, Honeywell International has a trailing 12 month P/E ratio of 25.4 and a P/B ratio of 7.83.
Honeywell International's PEG ratio is 2.95, which shows that the stock is probably overvalued in terms of its estimated growth. For reference, a PEG ratio near or below 1 is a potential signal that a company is undervalued.
Irregular Cash Flows With a Downwards Trend:
| 2018 | 2019 | 2020 | 2021 | 2022 | 2023 | |
|---|---|---|---|---|---|---|
| Revenue (MM) | $41,802 | $36,709 | $32,637 | $34,392 | $35,466 | $36,408 |
| Revenue Growth | n/a | -12.18% | -11.09% | 5.38% | 3.12% | 2.66% |
| Operating Margins | 18% | 21% | 18% | 21% | 18% | 19% |
| Net Margins | 16% | 17% | 15% | 16% | 14% | 15% |
| Net Income (MM) | $6,828 | $6,230 | $4,865 | $5,610 | $4,967 | $5,445 |
| Net Interest Expense (MM) | $1,149 | $1,065 | $675 | $1,378 | $414 | $707 |
| Depreciation & Amort. (MM) | $1,116 | $673 | $644 | $674 | $657 | $656 |
| Earnings Per Share | $8.98 | $8.41 | $6.72 | $7.91 | $7.27 | $8.07 |
| EPS Growth | n/a | -6.35% | -20.1% | 17.71% | -8.09% | 11.0% |
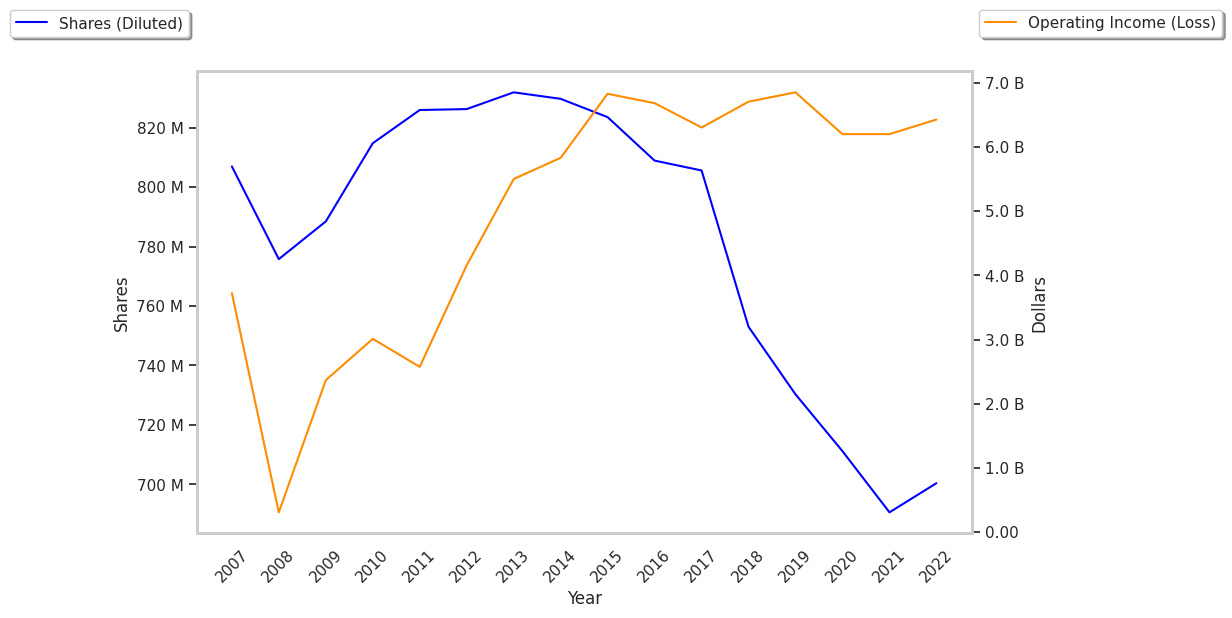
| Diluted Shares (MM) | 753 | 730 | 711 | 700 | 683 | 637 |
| Free Cash Flow (MM) | $5,606 | $6,058 | $5,302 | $5,143 | $4,508 | $3,835 |
| Capital Expenditures (MM) | $828 | $839 | $906 | $895 | $766 | $916 |
| Current Ratio | 1.29 | 1.34 | 1.47 | 1.3 | 1.25 | 1.35 |
| Total Debt (MM) | $19,086 | $16,002 | $22,384 | $19,599 | $19,647 | $20,370 |
| Net Debt / EBITDA | 1.14 | 0.84 | 1.22 | 1.09 | 1.42 | 1.68 |