Intel logged a 1.2% change during today's afternoon session, and is now trading at a price of $46.22 per share.
Intel returned gains of 72.8% last year, with its stock price reaching a high of $47.27 and a low of $24.73. Over the same period, the stock outperformed the S&P 500 index by 48.8%. More recently, the company's 50-day average price was $39.81. Intel Corporation designs, develops, manufactures, markets, and sells computing and related products worldwide. Based in Santa Clara, CA, the large-cap Technology company has 120,300 full time employees. Intel has offered a 2.1% dividend yield over the last 12 months.
The Business Is Unprofitable and Its Balance Sheet Is Highly Leveraged:
| 2018 | 2019 | 2020 | 2021 | 2022 | 2023 | |
|---|---|---|---|---|---|---|
| Revenue (MM) | $70,848 | $71,965 | $77,867 | $79,024 | $63,054 | $52,864 |
| Revenue Growth | n/a | 1.58% | 8.2% | 1.49% | -20.21% | -16.16% |
| Operating Margins | 33% | 33% | 32% | 27% | 12% | -5% |
| Net Margins | 30% | 28% | 27% | 25% | 13% | 0% |
| Net Income (MM) | $21,053 | $21,048 | $20,899 | $19,868 | $8,017 | -$2 |
| Net Interest Expense (MM) | $126 | $484 | -$504 | -$482 | $1,166 | $662 |
| Depreciation & Amort. (MM) | $7,520 | $9,204 | $10,482 | $9,953 | $11,128 | $8,572 |
| Earnings Per Share | $4.48 | $4.71 | $4.94 | $4.86 | $1.94 | -$0.4200000000000001 |
| EPS Growth | n/a | 5.13% | 4.88% | -1.62% | -60.08% | -121.65% |
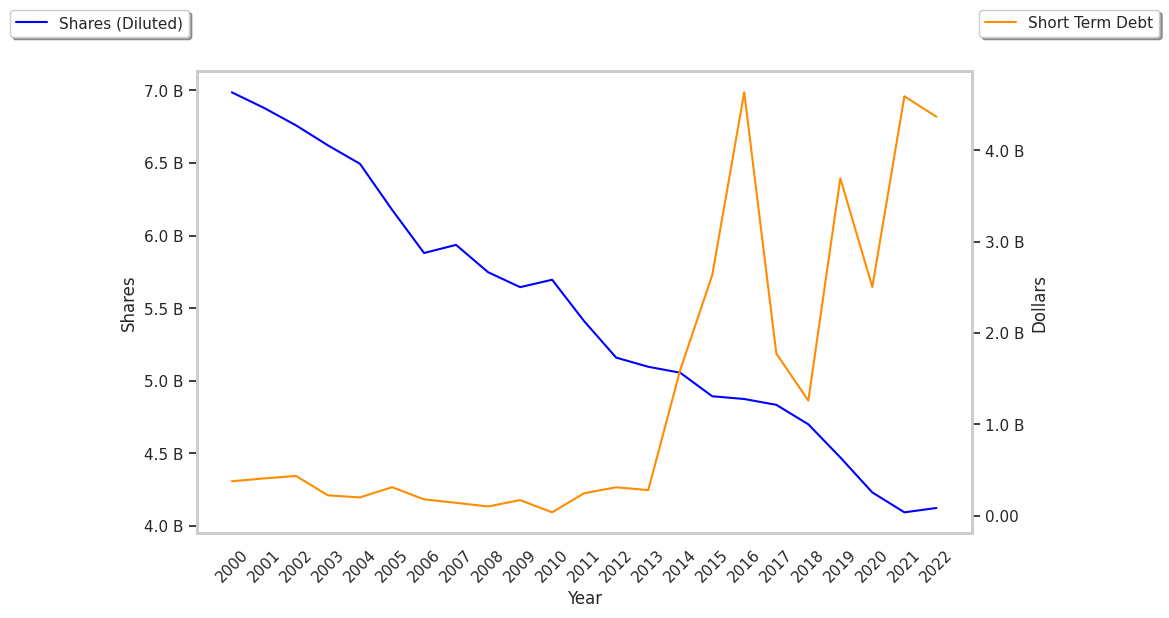
| Diluted Shares (MM) | 4,701 | 4,473 | 4,232 | 4,090 | 4,123 | 4,370 |
| Free Cash Flow (MM) | $14,251 | $16,932 | $21,605 | $10,723 | -$9,411 | -$10,203 |
| Capital Expenditures (MM) | $15,181 | $16,213 | $14,259 | $18,733 | $24,844 | $24,753 |
| Current Ratio | 1.73 | 1.4 | 1.91 | 2.13 | 1.57 | 1.53 |
| Total Debt (MM) | $28,846 | $29,001 | $36,401 | $38,101 | $42,051 | $48,879 |
| Net Debt / EBITDA | 0.84 | 0.75 | 0.86 | 1.05 | 1.64 | 7.18 |
Intel has declining EPS growth, irregular cash flows, and a highly leveraged balance sheet. Intel has declining revenues and increasing reinvestment in the business and average net margins with a negative growth trend.
Intel does not have a meaningful trailing P/E ratio since its earnings per share are currently in the red. Based on its EPS guidance of $1.74, the company has a forward P/E ratio of 22.9. In comparison, the average P/E ratio for the Technology sector is 35.0. On the other hand, the market is undervaluing Intel in terms of its equity because its P/B ratio is 1.91. In comparison, the sector average is 7.92.
There's an Analyst Consensus that Shares Are Overpriced for Intel:
The 36 analysts following Intel have set target prices ranging from $15.6 to $51.4 per share, for an average of $35.47 with a hold rating. As of April 2023, the company is trading 12.2% away from its average target price, indicating that there is an analyst belief that shares are overpriced.
Intel has a very low short interest because 1.8% of the company's shares are sold short. Institutions own 65.9% of the company's shares, and the insider ownership rate stands at 0.06%, suggesting a small amount of insider investors. The largest shareholder is Vanguard Group Inc, whose 9% stake in the company is worth $17,615,578,757.