We've been asking ourselves recently if the market has placed a fair valuation on New York Community Bancorp. Let's dive into some of the fundamental values of this mid-cap Finance company to determine if there might be an opportunity here for value-minded investors.
New York Community Bancorp's Earnings and Assets May Be Undervalued:
New York Community Bancorp, Inc. operates as the bank holding company for Flagstar Bank, N. The company belongs to the Finance sector, which has an average price to earnings (P/E) ratio of 12.38 and an average price to book (P/B) ratio of 1.58. In contrast, New York Community Bancorp has a trailing 12 month P/E ratio of 2.7 and a P/B ratio of 0.72.
When we divide New York Community Bancorp's P/E ratio by its expected EPS growth rate of the next five years, we obtain its PEG ratio of -25.63. Since it's negative, the company has negative growth expectations, and most investors will probably avoid the stock unless it has an exceptionally low P/E and P/B ratio.
Growing Revenues With Increasing Reinvestment in the Business:
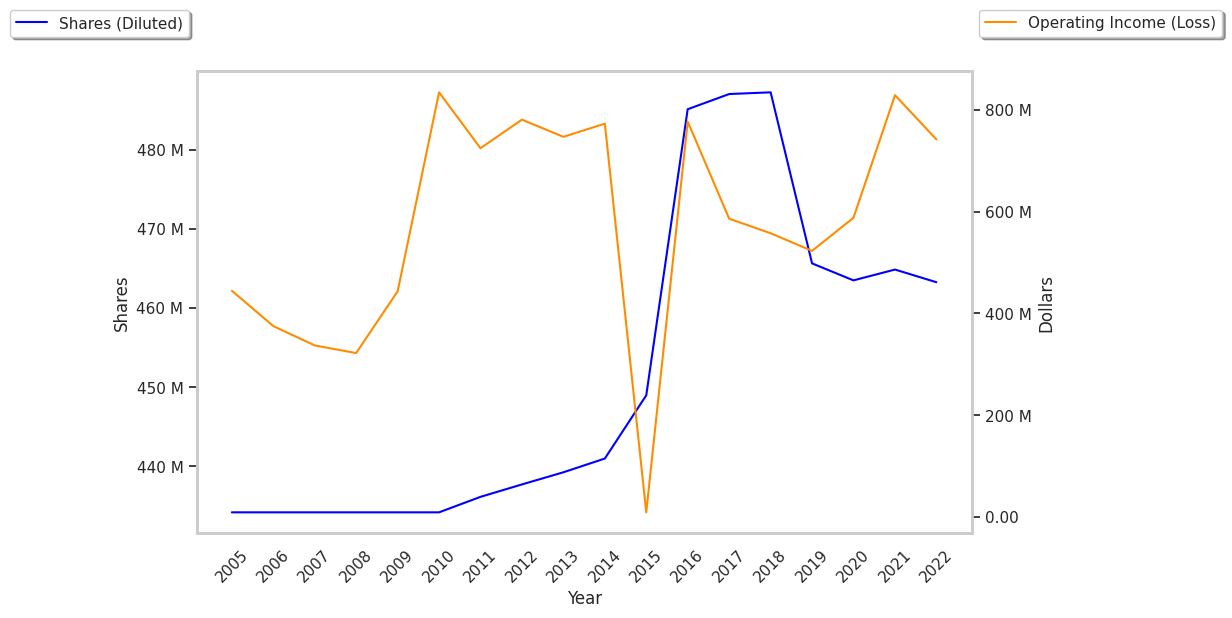
| 2018 | 2019 | 2020 | 2021 | 2022 | 2023 | |
|---|---|---|---|---|---|---|
| Revenue (MM) | $1,690 | $1,805 | $1,708 | $1,689 | $2,092 | $4,725 |
| Revenue Growth | n/a | 6.83% | -5.37% | -1.11% | 23.86% | 125.86% |
| Interest Income (MM) | $1,031 | $957 | $1,100 | $1,289 | $1,396 | $2,716 |
| Operating Margins | 33% | 28% | 34% | 48% | 39% | 62% |
| Net Margins | 25% | 22% | 30% | 35% | 31% | 59% |
| Net Income (MM) | $422 | $395 | $511 | $596 | $650 | $2,798 |
| Depreciation & Amort. (MM) | $32 | $27 | $24 | $21 | $18 | $95 |
| Earnings Per Share | $0.79 | $0.77 | $1.02 | $1.2 | $1.26 | $3.99 |
| EPS Growth | n/a | -2.53% | 32.47% | 17.65% | 5.0% | 216.67% |
| Diluted Shares (MM) | 487 | 466 | 463 | 465 | 485 | 1,223 |
| Free Cash Flow (MM) | $531 | $519 | $335 | $286 | $1,023 | -$124 |
| Capital Expenditures (MM) | $10 | -$9 | -$1 | $4 | $3 | $3 |