Today we're going to take a closer look at large-cap Energy company Schlumberger, whose shares are currently trading at $52.72. We've been asking ourselves whether the company is under or over valued at today's prices... let's perform a brief value analysis to find out!
Schlumberger Has Elevated P/B and P/E Ratios:
Schlumberger Limited engages in the provision of technology for the energy industry worldwide. The company operates through four divisions: Digital & Integration, Reservoir Performance, Well Construction, and Production Systems. The company provides field development and hydrocarbon production, carbon management, integration of adjacent energy systems; reservoir interpretation and data processing services for exploration data; and well construction and production improvement services and products. The company belongs to the Energy sector, which has an average price to earnings (P/E) ratio of 8.53 and an average price to book (P/B) ratio of 1.78. In contrast, Schlumberger has a trailing 12 month P/E ratio of 18.3 and a P/B ratio of 3.87.
When we divideSchlumberger's P/E ratio by its expected five-year EPS growth rate, we obtain a PEG ratio of 0.73, which indicates that the market is undervaluing the company's projected growth (a PEG ratio of 1 indicates a fairly valued company). Your analysis of the stock shouldn't end here. Rather, a good PEG ratio should alert you that it may be worthwhile to take a closer look at the stock.
The Business Has Negative Margins on Average:
| 2018 | 2019 | 2020 | 2021 | 2022 | 2023 | |
|---|---|---|---|---|---|---|
| Revenue (MM) | $32,815 | $32,917 | $23,601 | $22,929 | $28,091 | $32,024 |
| Revenue Growth | n/a | 0.31% | -28.3% | -2.85% | 22.51% | 14.0% |
| Operating Margins | 8% | -32% | -48% | 10% | 15% | 16% |
| Net Margins | 7% | 0% | 0% | 8% | 12% | 13% |
| Net Income (MM) | $2,177 | $30 | $32 | $1,928 | $3,492 | $4,210 |
| Net Interest Expense (MM) | $575 | $609 | $563 | $539 | $490 | $494 |
| Depreciation & Amort. (MM) | $3,556 | $3,589 | $2,566 | $2,120 | $2,147 | $2,252 |
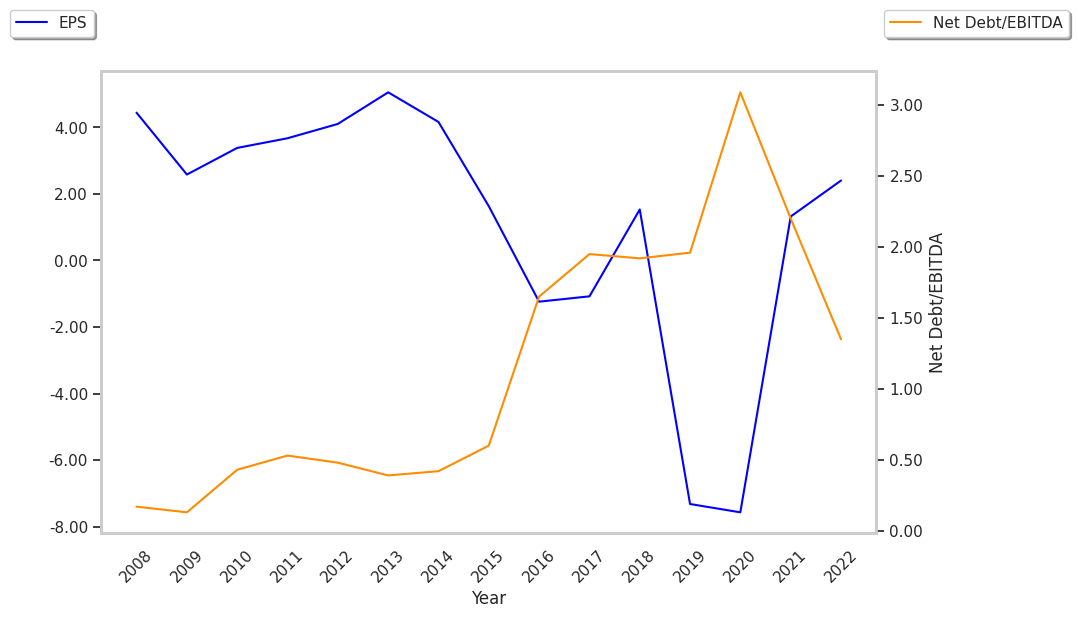
| Earnings Per Share | $1.53 | -$7.32 | -$7.57 | $1.32 | $2.39 | $2.88 |
| EPS Growth | n/a | -578.43% | -3.42% | 117.44% | 81.06% | 20.5% |
| Diluted Shares (MM) | 1,393 | 1,385 | 1,390 | 1,427 | 1,437 | 1,458 |
| Free Cash Flow (MM) | $3,553 | $3,707 | $1,828 | $3,510 | $2,102 | $3,312 |
| Capital Expenditures (MM) | $2,160 | $1,724 | $1,116 | $1,141 | $1,618 | $1,917 |
| Current Ratio | 1.17 | 1.19 | 1.23 | 1.22 | 1.25 | 1.36 |
| Total Debt (MM) | $20,454 | $19,914 | $20,795 | $17,993 | $16,031 | $17,161 |
| Net Debt / EBITDA | 3.08 | -2.75 | -2.28 | 3.61 | 2.24 | 1.97 |