Today we're going to take a closer look at large-cap Finance company CBRE, whose shares are currently trading at $90.81. We've been asking ourselves whether the company is under or over valued at today's prices... let's perform a brief value analysis to find out!
CBRE Has Elevated P/B and P/E Ratios:
CBRE Group, Inc. operates as a commercial real estate services and investment company worldwide. The company belongs to the Finance sector, which has an average price to earnings (P/E) ratio of 12.38 and an average price to book (P/B) ratio of 1.58. In contrast, CBRE has a trailing 12 month P/E ratio of 47.8 and a P/B ratio of 3.51.
CBRE's PEG ratio is 2.22, which shows that the stock is probably overvalued in terms of its estimated growth. For reference, a PEG ratio near or below 1 is a potential signal that a company is undervalued.
Increasing Revenues but Narrowing Margins:
| 2018 | 2019 | 2020 | 2021 | 2022 | 2023 | |
|---|---|---|---|---|---|---|
| Revenue (MM) | $21,340 | $23,894 | $23,826 | $27,746 | $30,828 | $31,194 |
| Revenue Growth | n/a | 11.97% | -0.28% | 16.45% | 11.11% | 1.18% |
| Interest Income (MM) | $107 | $29 | $17 | $204 | -$12 | $23 |
| Operating Margins | 6% | 6% | 4% | 9% | 5% | 3% |
| Net Margins | 5% | 5% | 3% | 7% | 5% | 2% |
| Net Income (MM) | $1,066 | $1,291 | $756 | $1,842 | $1,424 | $618 |
| Depreciation & Amort. (MM) | $452 | $439 | $502 | $526 | $613 | $625 |
| Earnings Per Share | $3.1 | $3.77 | $2.22 | $5.41 | $4.29 | $1.89 |
| EPS Growth | n/a | 21.61% | -41.11% | 143.69% | -20.7% | -55.94% |
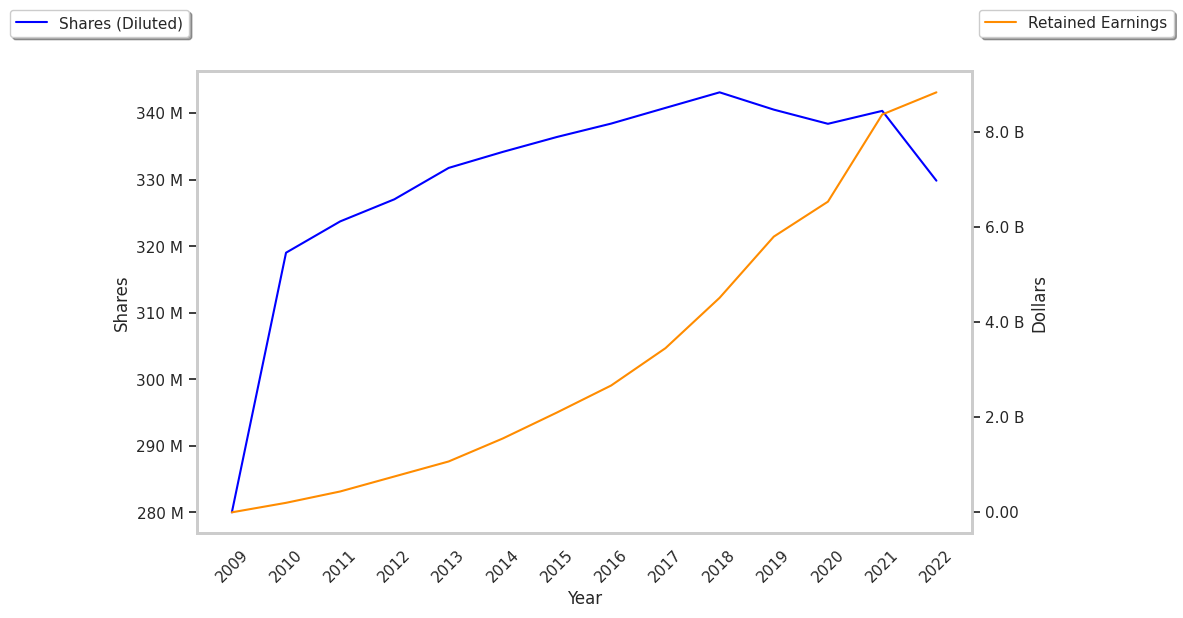
| Diluted Shares (MM) | 343 | 341 | 338 | 340 | 328 | 278 |
| Free Cash Flow (MM) | $903 | $930 | $1,564 | $2,154 | $1,369 | $142 |
| Capital Expenditures (MM) | $228 | $294 | $267 | $210 | $260 | $298 |
| Current Ratio | 1.16 | 1.17 | 1.24 | 1.2 | 1.03 | 1.19 |
| Total Debt (MM) | $6,208 | $9,037 | $9,384 | $10,805 | $10,097 | $11,505 |
| Net Debt / EBITDA | 2.97 | 4.48 | 5.09 | 2.85 | 3.87 | 6.92 |
CBRE's financial statements include several red flags such as weak operating margins with a negative growth trend, declining EPS growth, and irregular cash flows. Additionally, the firm has a highly leveraged balance sheet. On the other hand, the company has growing revenues and a flat capital expenditure trend working in its favor.