General Motors Company shares fell by -1.1% during the day's evening session, and are now trading at a price of $35.47. Is it time to buy the dip? To better answer that question, it's essential to check if the market is valuing the company's shares fairly in terms of its earnings and equity levels.
The Market May Be Undervaluing General Motors Company's Assets and Equity:
General Motors Company designs, builds, and sells trucks, crossovers, cars, and automobile parts; and provide software-enabled services and subscriptions worldwide. The company belongs to the Consumer Discretionary sector, which has an average price to earnings (P/E) ratio of 22.96 and an average price to book (P/B) ratio of 4.24. In contrast, General Motors Company has a trailing 12 month P/E ratio of 5.0 and a P/B ratio of 0.67.
General Motors Company's PEG ratio is 1.27, which shows that the stock is probably overvalued in terms of its estimated growth. For reference, a PEG ratio near or below 1 is a potential signal that a company is undervalued.
Overview of the Company's Finances:
| 2018 | 2019 | 2020 | 2021 | 2022 | 2023 | |
|---|---|---|---|---|---|---|
| Revenue (MM) | $147,049 | $137,237 | $122,485 | $127,004 | $156,735 | $171,970 |
| Revenue Growth | n/a | -6.67% | -10.75% | 3.69% | 23.41% | 9.72% |
| Operating Margins | 6% | 5% | 7% | 10% | 7% | 7% |
| Net Margins | 5% | 5% | 5% | 8% | 6% | 6% |
| Net Income (MM) | $8,084 | $6,732 | $6,427 | $10,019 | $9,934 | $10,023 |
| Net Interest Expense (MM) | $2,596 | $1,469 | $4,121 | $4,121 | $1,432 | $1,242 |
| Earnings Per Share | $5.53 | $4.57 | $4.33 | $6.7 | $6.13 | $7.11 |
| EPS Growth | n/a | -17.36% | -5.25% | 54.73% | -8.51% | 15.99% |
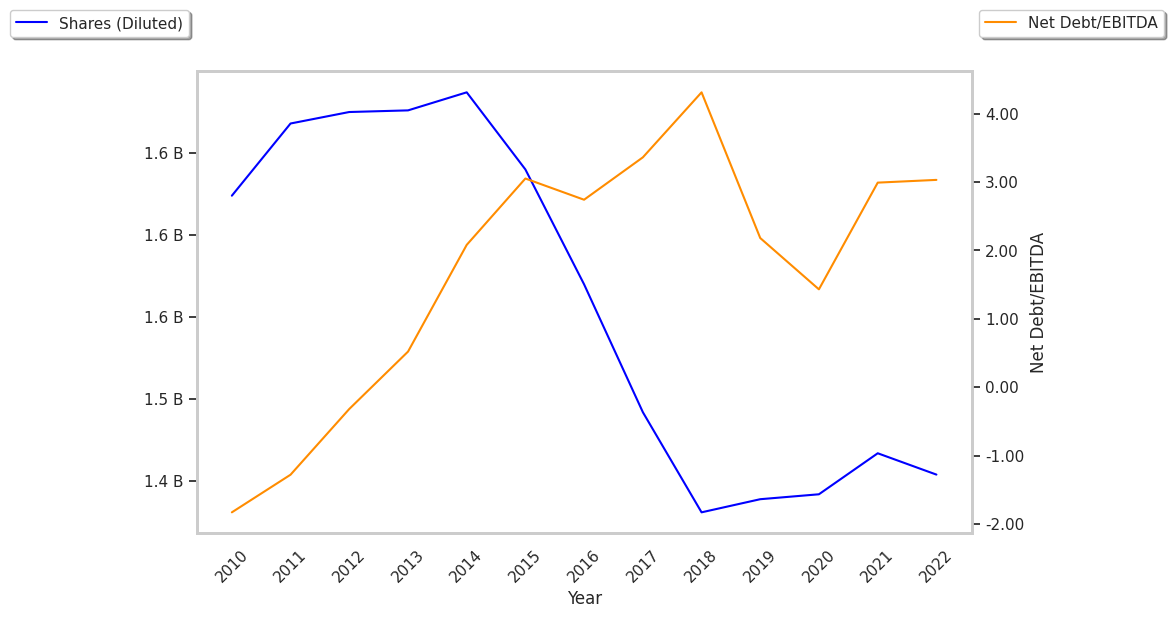
| Diluted Shares (MM) | 1,431 | 1,439 | 1,442 | 1,468 | 1,454 | 1,231 |
| Free Cash Flow (MM) | $6,495 | $7,429 | $11,370 | $7,679 | $6,805 | $12,328 |
| Capital Expenditures (MM) | $8,761 | $7,592 | $5,300 | $7,509 | $9,238 | $10,569 |
| Current Ratio | 0.92 | 0.88 | 1.01 | 1.1 | 1.1 | 1.14 |
| Total Debt (MM) | $71,310 | $64,992 | $72,976 | $75,299 | $75,521 | $96,759 |
General Motors Company has weak revenue growth and increasing reinvestment in the business, positive EPS growth, and irregular cash flows. Furthermore, General Motors Company has average net margins with a stable trend and an average amount of debt.