Sysco logged a -0.1% change during today's evening session, and is now trading at a price of $73.25 per share.
Over the last year, Sysco logged a -5.0% change, with its stock price reaching a high of $82.38 and a low of $62.24. Over the same period, the stock underperformed the S&P 500 index by -27.9%. As of April 2023, the company's 50-day average price was $69.02. Sysco Corporation, through its subsidiaries, engages in the marketing and distribution of various food and related products to the foodservice or food-away-from-home industry in the United States, Canada, the United Kingdom, France, and internationally. Based in Houston, TX, the large-cap Consumer Discretionary company has 72,000 full time employees. Sysco has offered a 2.7% dividend yield over the last 12 months.
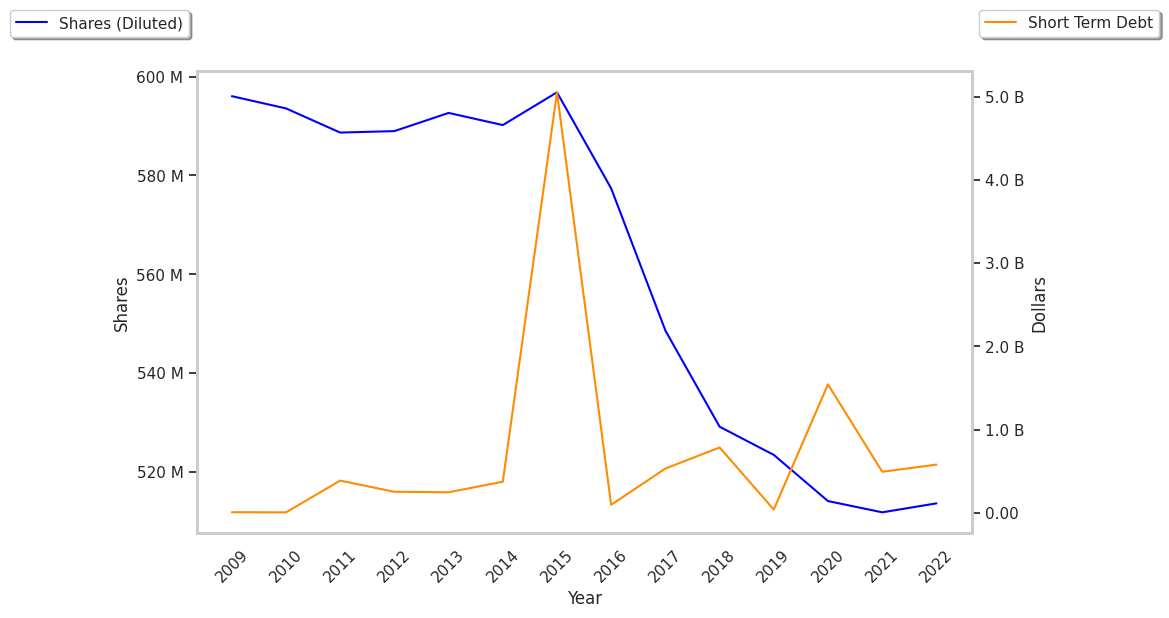
The Company May Be Profitable, but Its Balance Sheet Is Highly Leveraged:
| 2018 | 2019 | 2020 | 2021 | 2022 | 2023 | |
|---|---|---|---|---|---|---|
| Revenue (MM) | $58,727 | $60,114 | $52,893 | $51,298 | $68,636 | $76,325 |
| Revenue Growth | n/a | 2.36% | -12.01% | -3.02% | 33.8% | 11.2% |
| Operating Margins | 4% | 4% | 1% | 3% | 3% | 4% |
| Net Margins | 2% | 3% | 0% | 1% | 2% | 2% |
| Net Income (MM) | $1,431 | $1,674 | $215 | $524 | $1,359 | $1,770 |
| Net Interest Expense (MM) | $38 | $36 | -$48 | $18 | $24 | -$226 |
| Depreciation & Amort. (MM) | $615 | $657 | $705 | $635 | $641 | $650 |
| Earnings Per Share | $2.7 | $3.2 | $0.42 | $1.02 | $2.64 | $3.47 |
| EPS Growth | n/a | 18.52% | -86.88% | 142.86% | 158.82% | 31.44% |
| Diluted Shares (MM) | 529 | 523 | 514 | 514 | 514 | 510 |
| Free Cash Flow (MM) | $1,468 | $1,719 | $898 | $1,433 | $1,158 | $2,074 |
| Capital Expenditures (MM) | $688 | $692 | $720 | $471 | $633 | $793 |
| Current Ratio | 1.25 | 1.25 | 1.79 | 1.38 | 1.24 | 1.29 |
| Total Debt (MM) | $8,812 | $8,887 | $14,453 | $11,083 | $11,052 | $10,893 |
| Net Debt / EBITDA | 2.75 | 2.8 | 5.97 | 4.33 | 3.53 | 2.8 |
Sysco has growing revenues and a flat capital expenditure trend, decent operating margins with a stable trend, and positive EPS growth. However, the firm suffers from irregular cash flows and a highly leveraged balance sheet.
Sysco's Valuation Is in Line With Its Sector Averages:
Sysco has a trailing twelve month P/E ratio of 19.4, compared to an average of 22.96 for the Consumer Discretionary sector. Based on its EPS guidance of $4.74, the company has a forward P/E ratio of 14.6. The 8.4% compound average growth rate of Sysco's historical and projected earnings per share yields a PEG ratio of 2.32. This suggests that these shares are overvalued. Furthermore, Sysco is likely overvalued compared to the book value of its equity, since its P/B ratio of 17.37 is higher than the sector average of 4.24. The company's shares are currently trading 304.2% above their Graham number.
Sysco Has an Average Rating of Buy:
The 13 analysts following Sysco have set target prices ranging from $73.0 to $87.0 per share, for an average of $79.69 with a buy rating. As of April 2023, the company is trading -13.4% away from its average target price, indicating that there is an analyst consensus of some upside potential.
Sysco has a very low short interest because 1.6% of the company's shares are sold short. Institutions own 83.8% of the company's shares, and the insider ownership rate stands at 0.12%, suggesting a small amount of insider investors. The largest shareholder is Vanguard Group Inc, whose 9% stake in the company is worth $3,503,210,916.