AT&T logged a -0.9% change during today's afternoon session, and is now trading at a price of $16.45 per share.
AT&T returned losses of -8.5% last year, with its stock price reaching a high of $21.53 and a low of $13.43. Over the same period, the stock underperformed the S&P 500 index by -31.4%. As of April 2023, the company's 50-day average price was $15.81. AT&T Inc. provides telecommunications and technology services worldwide. Based in Dallas, TX, the large-cap Telecommunications company has 152,740 full time employees. AT&T has offered a 6.7% dividend yield over the last 12 months.
The Company's Revenues Are Declining:
| 2018 | 2019 | 2020 | 2021 | 2022 | 2023 | |
|---|---|---|---|---|---|---|
| Revenue (MM) | $170,756 | $181,193 | $143,050 | $134,038 | $120,741 | $121,749 |
| Revenue Growth | n/a | 6.11% | -21.05% | -6.3% | -9.92% | 0.83% |
| Operating Margins | 15% | 15% | 6% | 22% | -3% | -2% |
| Net Margins | 12% | 8% | 1% | 16% | 1% | 1% |
| Net Income (MM) | $19,953 | $14,975 | $1,355 | $21,479 | $1,469 | $1,191 |
| Net Interest Expense (MM) | $8,450 | $8,622 | $7,850 | $9,387 | $6,108 | $6,538 |
| Depreciation & Amort. (MM) | $28,430 | $28,217 | $22,523 | $17,852 | $18,021 | $18,606 |
| Earnings Per Share | $2.85 | $1.89 | -$0.75 | $2.73 | -$1.13 | -$1.4800000000000004 |
| EPS Growth | n/a | -33.68% | -139.68% | 464.0% | -141.39% | -30.97% |
| Diluted Shares (MM) | 6,806 | 7,348 | 7,466 | 7,503 | 7,587 | 6,612 |
| Free Cash Flow (MM) | $22,351 | $29,033 | $28,440 | $26,412 | $16,186 | $19,803 |
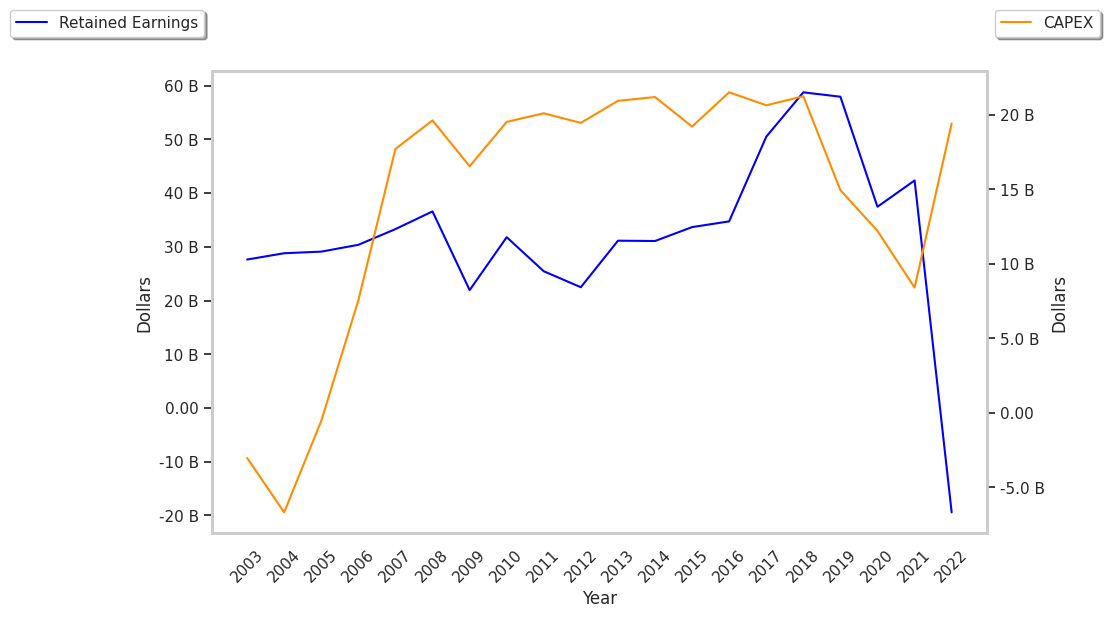
| Capital Expenditures (MM) | $21,251 | $19,635 | $14,690 | $15,545 | $19,626 | $17,481 |
| Current Ratio | 0.8 | 0.79 | 0.82 | 1.61 | 0.59 | 0.69 |
| Total Debt (MM) | $176,505 | $163,147 | $170,551 | $175,631 | $150,228 | $144,147 |
| Net Debt / EBITDA | 3.14 | 2.73 | 5.26 | 3.33 | 9.82 | 8.7 |
AT&T suffers from declining revenues and a flat capital expenditure trend, weak operating margins with a negative growth trend, and declining EPS growth. The firm's financial statements also exhibit irregular cash flows and a highly leveraged balance sheet.
AT&T does not have a meaningful trailing P/E ratio since its earnings per share are currently in the red. Based on its EPS guidance of $2.47, the company has a forward P/E ratio of 6.4. In comparison, the average P/E ratio for the Telecommunications sector is 23.78. On the other hand, the market is undervaluing AT&T in terms of its equity because its P/B ratio is 1.13. In comparison, the sector average is 3.46.
Analysts Give AT&T an Average Rating of Hold:
The 21 analysts following AT&T have set target prices ranging from $8.0 to $28.0 per share, for an average of $18.31 with a hold rating. As of April 2023, the company is trading -13.7% away from its average target price, indicating that there is an analyst consensus of some upside potential.
AT&T has a very low short interest because 1.5% of the company's shares are sold short. Institutions own 56.9% of the company's shares, and the insider ownership rate stands at 0.07%, suggesting a small amount of insider investors. The largest shareholder is Vanguard Group Inc, whose 9% stake in the company is worth $10,206,233,892.