Zoom Video Communications shares fell by -3.2% during the day's afternoon session, and are now trading at a price of $70.07. Is it time to buy the dip? To better answer that question, it's essential to check if the market is valuing the company's shares fairly in terms of its earnings and equity levels.
A Lower P/B Ratio Than Its Sector Average but Trades Above Its Graham Number:
Zoom Video Communications, Inc. provides unified communications platform in the Americas, the Asia Pacific, Europe, the Middle East, and Africa. The company belongs to the Technology sector, which has an average price to earnings (P/E) ratio of 35.0 and an average price to book (P/B) ratio of 7.92. In contrast, Zoom Video Communications has a trailing 12 month P/E ratio of 92.2 and a P/B ratio of 2.88.
Zoom Video Communications's PEG ratio is 9.77, which shows that the stock is probably overvalued in terms of its estimated growth. For reference, a PEG ratio near or below 1 is a potential signal that a company is undervalued.
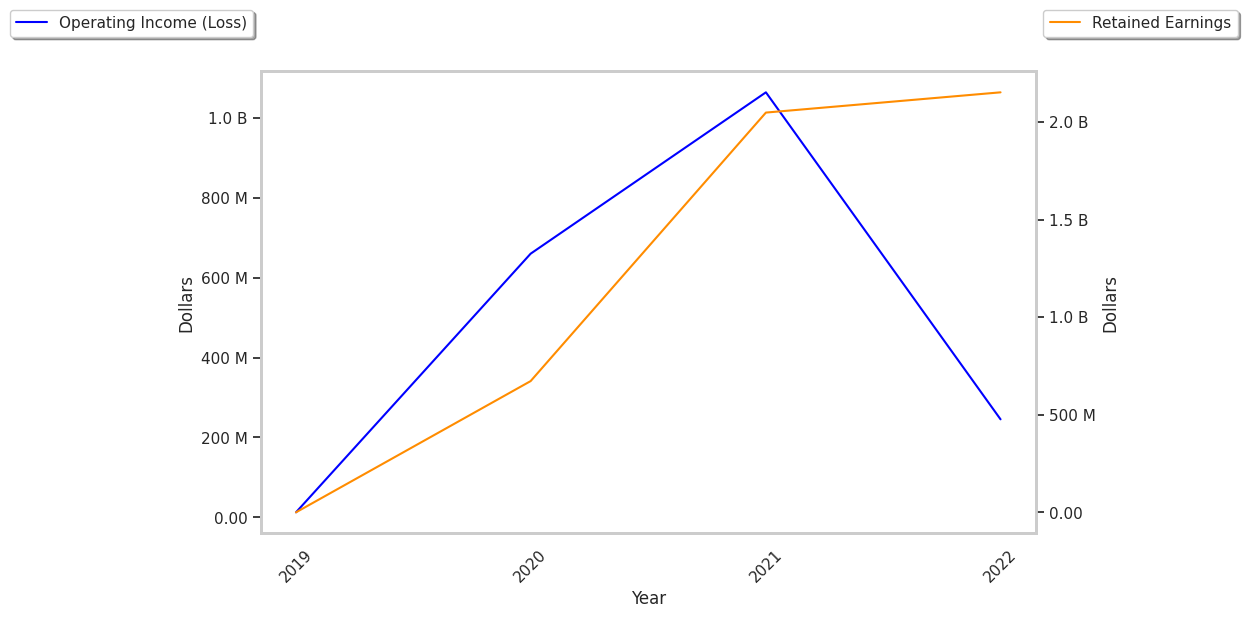
Growing Revenues With Increasing Reinvestment in the Business:
| 2019 | 2020 | 2021 | 2022 | 2023 | |
|---|---|---|---|---|---|
| Revenue (MM) | $331 | $623 | $2,651 | $4,100 | $4,393 |
| Revenue Growth | n/a | 88.39% | 325.81% | 54.63% | 7.15% |
| Operating Margins | 3% | 4% | 26% | 27% | 6% |
| Net Margins | 2% | 4% | 25% | 34% | 2% |
| Net Income (MM) | $8 | $25 | $672 | $1,376 | $104 |
| Net Interest Expense (MM) | $2 | $14 | $16 | -$6 | $41 |
| Depreciation & Amort. (MM) | $7 | $16 | $29 | $48 | $82 |
| Diluted Shares (MM) | 116 | 254 | 298 | 306 | 304 |
| Free Cash Flow (MM) | $23 | $114 | $1,391 | $1,473 | $1,186 |
| Capital Expenditures (MM) | $28 | $38 | $80 | $133 | $104 |
| Current Ratio | 3.21 | 1.86 | 3.61 | 3.24 | 4.27 |
| Total Debt (MM) | $109 | $461 | $222 | $356 | $237 |
| Net Debt / EBITDA | -11.25 | -13.27 | -1.59 | -0.65 | -3.8 |
Zoom Video Communications has growing revenues and increasing reinvestment in the business, low leverage, and irregular cash flows. However, the firm has weak operating margins with a positive growth rate. Finally, we note that Zoom Video Communications has positive expected EPS Growth.