Today we're going to take a closer look at large-cap Industrials company Howmet Aerospace, whose shares are currently trading at $54.31. We've been asking ourselves whether the company is under or over valued at today's prices... let's perform a brief value analysis to find out!
Howmet Aerospace Has Elevated P/B and P/E Ratios:
Howmet Aerospace Inc. provides advanced engineered solutions for the aerospace and transportation industries in the United States, Japan, France, Germany, the United Kingdom, Mexico, Italy, Canada, Poland, China, and internationally. The company belongs to the Industrials sector, which has an average price to earnings (P/E) ratio of 22.19 and an average price to book (P/B) ratio of 4.06. In contrast, Howmet Aerospace has a trailing 12 month P/E ratio of 35.3 and a P/B ratio of 5.86.
Howmet Aerospace's PEG ratio is 1.42, which shows that the stock is probably overvalued in terms of its estimated growth. For reference, a PEG ratio near or below 1 is a potential signal that a company is undervalued.
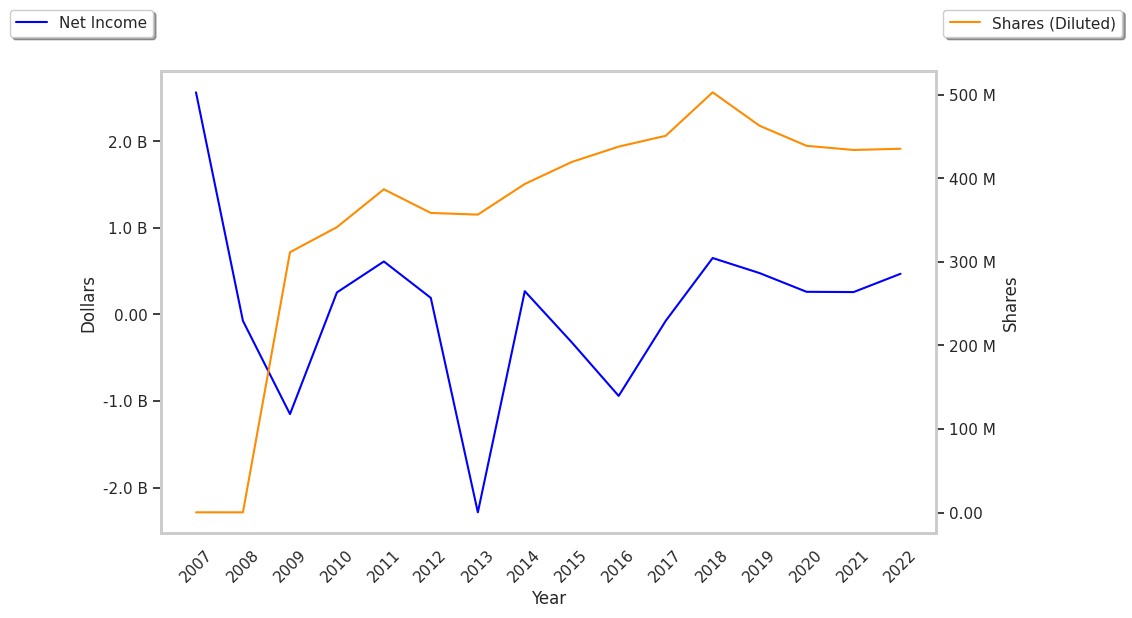
EPS Trend Sustained Primarily by Reducing the Number of Shares Outstanding:
| 2018 | 2019 | 2020 | 2021 | 2022 | 2023 | |
|---|---|---|---|---|---|---|
| Revenue (MM) | $6,778 | $7,098 | $5,259 | $4,972 | $5,663 | $6,422 |
| Revenue Growth | n/a | 4.72% | -25.91% | -5.46% | 13.9% | 13.4% |
| Operating Margins | 13% | 8% | 12% | 15% | 16% | 17% |
| Net Margins | 10% | 7% | 5% | 5% | 8% | 10% |
| Net Income (MM) | $651 | $477 | $261 | $258 | $469 | $640 |
| Net Interest Expense (MM) | $38 | $338 | $317 | $259 | $229 | $223 |
| Depreciation & Amort. (MM) | $576 | $536 | $338 | $270 | $265 | $271 |
| Diluted Shares (MM) | 503 | 463 | 439 | 435 | 421 | 404 |
| Free Cash Flow (MM) | -$551 | $461 | -$258 | $250 | $540 | $689 |
| Current Ratio | 1.87 | 1.42 | 2.21 | 2.18 | 2.12 | 2.14 |
| Total Debt (MM) | $6,330 | $10,274 | $5,075 | $4,306 | $4,237 | $4,047 |
| Net Debt / EBITDA | 2.81 | 7.8 | 3.59 | 3.52 | 2.91 | 2.65 |
Howmet Aerospace's financial statements include several red flags such as weak revenue growth and decreasing reinvestment in the business, weak operating margins with a stable trend, and EPS growth achieved by reducing the number of outstanding shares. Additionally, the firm has a highly leveraged balance sheet. On the other hand, the company has irregular cash flows working in its favor.