We've been asking ourselves recently if the market has placed a fair valuation on Deere & Company. Let's dive into some of the fundamental values of this large-cap Industrials company to determine if there might be an opportunity here for value-minded investors.
A Very Low P/E Ratio but Trades Above Its Graham Number:
Deere & Company engages in the manufacture and distribution of various equipment worldwide. The company belongs to the Industrials sector, which has an average price to earnings (P/E) ratio of 22.19 and an average price to book (P/B) ratio of 4.06. In contrast, Deere & Company has a trailing 12 month P/E ratio of 11.5 and a P/B ratio of 5.17.
When we divide Deere & Company's P/E ratio by its expected EPS growth rate of the next five years, we obtain its PEG ratio of -2.8. Since it's negative, the company has negative growth expectations, and most investors will probably avoid the stock unless it has an exceptionally low P/E and P/B ratio.
Growing Revenues With Increasing Reinvestment in the Business:
| 2018 | 2019 | 2020 | 2021 | 2022 | 2023 | |
|---|---|---|---|---|---|---|
| Revenue (MM) | $37,358 | $39,258 | $35,540 | $44,024 | $52,577 | $61,376 |
| Revenue Growth | n/a | 5.09% | -9.47% | 23.87% | 19.43% | 16.74% |
| Operating Margins | 12% | 11% | 12% | 18% | 18% | 21% |
| Net Margins | 6% | 8% | 8% | 14% | 14% | 16% |
| Net Income (MM) | $2,368 | $3,253 | $2,751 | $5,963 | $7,131 | $10,043 |
| Net Interest Expense (MM) | $1,204 | $1,466 | $1,247 | $993 | $1,062 | $2,021 |
| Depreciation & Amort. (MM) | $754 | $779 | $800 | $2,050 | $1,895 | $1,979 |
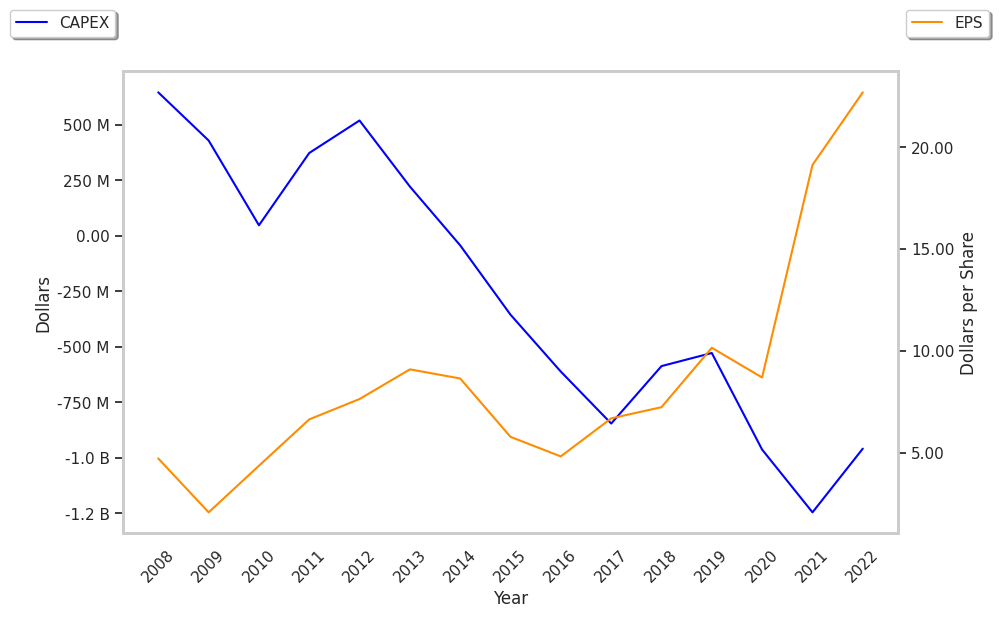
| Earnings Per Share | $7.24 | $10.15 | $8.69 | $18.99 | $23.28 | $33.79 |
| EPS Growth | n/a | 40.19% | -14.38% | 118.53% | 22.59% | 45.15% |
| Diluted Shares (MM) | 327 | 321 | 317 | 314 | 306 | 292 |
| Free Cash Flow (MM) | $926 | $2,292 | $6,663 | $6,878 | $3,565 | $5,752 |
| Capital Expenditures (MM) | $896 | $1,120 | $820 | $848 | $1,134 | $1,425 |
| Total Debt (MM) | $47,274 | $50,564 | $8,582 | $10,919 | $12,592 | $17,143 |
| Net Debt / EBITDA | 8.29 | 8.99 | 0.3 | 0.29 | 0.69 | 0.71 |
Deere & Company has growing revenues and increasing reinvestment in the business, exceptional EPS growth, and irregular cash flows. However, the firm has a highly leveraged balance sheet. Finally, we note that Deere & Company has average net margins with a positive growth rate.