We've been asking ourselves recently if the market has placed a fair valuation on Crown Castle. Let's dive into some of the fundamental values of this large-cap Real Estate company to determine if there might be an opportunity here for value-minded investors.
Crown Castle Has Elevated P/B and P/E Ratios:
Crown Castle owns, operates and leases more than 40,000 cell towers and approximately 85,000 route miles of fiber supporting small cells and fiber solutions across every major U.S. The company belongs to the Real Estate sector, which has an average price to earnings (P/E) ratio of 25.55 and an average price to book (P/B) ratio of 2.1. In contrast, Crown Castle has a trailing 12 month P/E ratio of 32.2 and a P/B ratio of 7.5.
When we divide Crown Castle's P/E ratio by its expected EPS growth rate of the next five years, we obtain its PEG ratio of -3.5. Since it's negative, the company has negative growth expectations, and most investors will probably avoid the stock unless it has an exceptionally low P/E and P/B ratio.
Exceptional Profitability Overshadowed by Excessive Leverage:
| 2018 | 2019 | 2020 | 2021 | 2022 | 2023 | |
|---|---|---|---|---|---|---|
| Revenue (MM) | $5,370 | $5,763 | $5,840 | $6,340 | $6,986 | $7,071 |
| Revenue Growth | n/a | 7.32% | 1.34% | 8.56% | 10.19% | 1.22% |
| Operating Margins | 26% | 27% | 32% | 32% | 35% | 34% |
| Net Margins | 12% | 15% | 18% | 18% | 24% | 22% |
| Net Income (MM) | $622 | $881 | $1,056 | $1,158 | $1,675 | $1,552 |
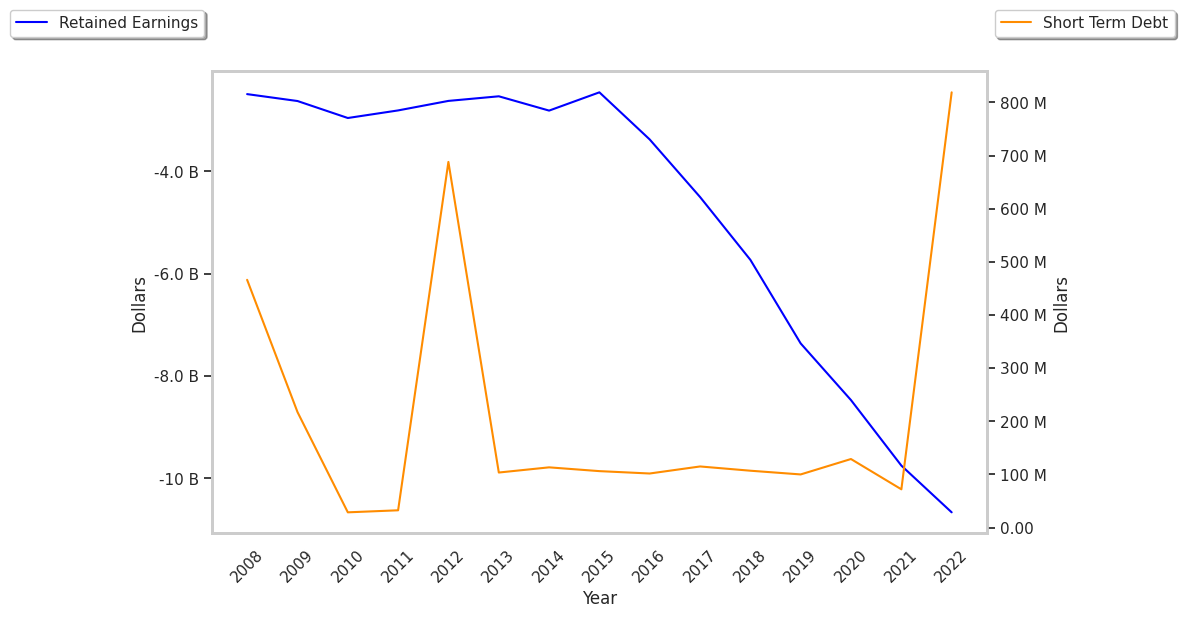
| Net Interest Expense (MM) | $16 | $21 | $31 | -$17 | $699 | $820 |
| Depreciation & Amort. (MM) | $1,527 | $1,572 | $1,608 | $1,644 | $1,707 | $1,745 |
| Earnings Per Share | $1.23 | $1.79 | $2.35 | $2.53 | $3.86 | $3.58 |
| EPS Growth | n/a | 45.53% | 31.28% | 7.66% | 52.57% | -7.25% |
| Diluted Shares (MM) | 417 | 418 | 425 | 434 | 434 | 434 |
| Free Cash Flow (MM) | $761 | $641 | $1,431 | $1,560 | $1,568 | $1,642 |
| Capital Expenditures (MM) | $1,739 | $2,057 | $1,624 | $1,229 | $1,310 | $1,456 |
| Current Ratio | 0.82 | 0.63 | 0.56 | 0.62 | 0.45 | 0.44 |
| Total Debt (MM) | $16,682 | $18,121 | $19,280 | $20,629 | $21,729 | $22,730 |
| Net Debt / EBITDA | 5.64 | 5.73 | 5.49 | 5.58 | 5.22 | 5.46 |
Crown Castle has strong margins with a stable trend and growing revenues and decreasing reinvestment in the business. Additionally, the company's financial statements display a strong EPS growth trend and irregular cash flows. However, the firm has a highly leveraged balance sheet.