We've been asking ourselves recently if the market has placed a fair valuation on Kraft Heinz. Let's dive into some of the fundamental values of this large-cap Consumer Staples company to determine if there might be an opportunity here for value-minded investors.
Kraft Heinz Has Attractive Multiples and Trades Below Its Graham Number:
The Kraft Heinz Company, together with its subsidiaries, manufactures and markets food and beverage products in the United States, Canada, the United Kingdom, and internationally. The company belongs to the Consumer Staples sector, which has an average price to earnings (P/E) ratio of 21.21 and an average price to book (P/B) ratio of 4.12. In contrast, Kraft Heinz has a trailing 12 month P/E ratio of 15.3 and a P/B ratio of 0.92.
Kraft Heinz's PEG ratio is 2.43, which shows that the stock is probably overvalued in terms of its estimated growth. For reference, a PEG ratio near or below 1 is a potential signal that a company is undervalued.
The Business Has Weak Operating Margins:
| 2018 | 2019 | 2020 | 2021 | 2022 | 2023 | |
|---|---|---|---|---|---|---|
| Revenue (MM) | $26,268 | $24,977 | $26,185 | $26,042 | $26,485 | $27,161 |
| Revenue Growth | n/a | -4.91% | 4.84% | -0.55% | 1.7% | 2.55% |
| Net Margins | -39% | 8% | 1% | 4% | 9% | 11% |
| Net Income (MM) | -$10,192 | $1,935 | $356 | $1,012 | $2,363 | $2,988 |
| Net Interest Expense (MM) | $1,284 | $1,361 | $1,394 | $2,047 | $921 | $900 |
| Depreciation & Amort. (MM) | $983 | $994 | $969 | $910 | $933 | $958 |
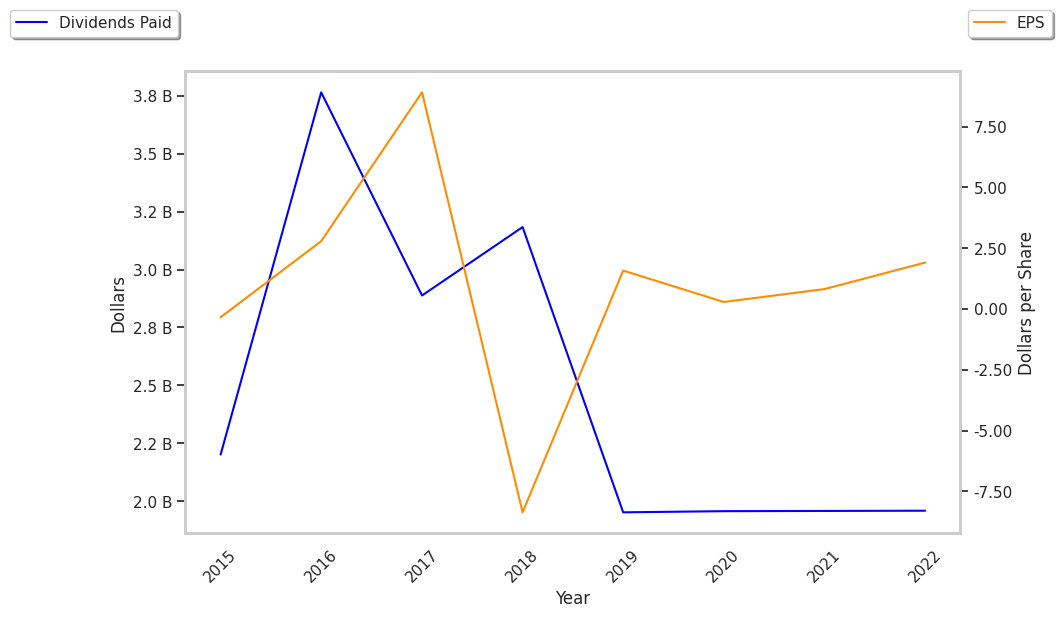
| Earnings Per Share | -$8.36 | $1.58 | $0.29 | $0.82 | $1.91 | $2.42 |
| EPS Growth | n/a | 118.9% | -81.65% | 182.76% | 132.93% | 26.7% |
| Diluted Shares (MM) | 1,219 | 1,224 | 1,228 | 1,236 | 1,235 | 1,235 |
| Free Cash Flow (MM) | $1,748 | $2,784 | $4,333 | $4,459 | $1,553 | $2,509 |
| Capital Expenditures (MM) | $826 | $768 | $596 | $905 | $916 | $1,063 |
| Current Ratio | 1.21 | 1.03 | 1.34 | 0.99 | 0.87 | 1.0 |
| Total Debt (MM) | $31,147 | $29,238 | $28,300 | $21,801 | $20,064 | $19,270 |
| Net Debt / EBITDA | -3.25 | 6.63 | 8.03 | 4.2 | 4.17 | 3.34 |
Kraft Heinz has weak operating margins with a positive growth rate, irregular cash flows, and a highly leveraged balance sheet. On the other hand, the company benefits from weak revenue growth and increasing reinvestment in the business and positive EPS growth.