Today we're going to take a closer look at large-cap Technology company Corning, whose shares are currently trading at $30.47. We've been asking ourselves whether the company is under or over valued at today's prices... let's perform a brief value analysis to find out!
A Lower P/B Ratio Than Its Sector Average but Trades Above Its Graham Number:
Corning Incorporated engages in the display technologies, optical communications, environmental technologies, specialty materials, and life sciences businesses worldwide. The company belongs to the Technology sector, which has an average price to earnings (P/E) ratio of 35.0 and an average price to book (P/B) ratio of 7.92. In contrast, Corning has a trailing 12 month P/E ratio of 44.8 and a P/B ratio of 2.19.
Corning's PEG ratio is 2.85, which shows that the stock is probably overvalued in terms of its estimated growth. For reference, a PEG ratio near or below 1 is a potential signal that a company is undervalued.
The Company Has a Highly Leveraged Balance Sheet and a Declining EPS Growth Trend:
| 2018 | 2019 | 2020 | 2021 | 2022 | 2023 | |
|---|---|---|---|---|---|---|
| Revenue (MM) | $11,290 | $11,503 | $11,303 | $14,082 | $14,189 | $13,000 |
| Revenue Growth | n/a | 1.89% | -1.74% | 24.59% | 0.76% | -8.38% |
| Operating Margins | 14% | 11% | 5% | 15% | 10% | 7% |
| Net Margins | 9% | 8% | 5% | 14% | 9% | 4% |
| Net Income (MM) | $1,066 | $960 | $512 | $1,906 | $1,316 | $585 |
| Net Interest Expense (MM) | $191 | $221 | $276 | $300 | $292 | $315 |
| Depreciation & Amort. (MM) | $1,199 | $1,390 | $1,399 | $129 | $123 | $123 |
| Earnings Per Share | $1.13 | $1.07 | $0.54 | $1.28 | $1.54 | $0.68 |
| EPS Growth | n/a | -5.31% | -49.53% | 137.04% | 20.31% | -55.84% |
| Diluted Shares (MM) | 941 | 899 | 772 | 844 | 857 | 859 |
| Free Cash Flow (MM) | $677 | $53 | $803 | $1,775 | $1,011 | $395 |
| Capital Expenditures (MM) | $2,242 | $1,978 | $1,377 | $1,637 | $1,604 | $1,514 |
| Current Ratio | 2.12 | 2.12 | 2.12 | 1.59 | 1.44 | 1.7 |
| Total Debt (MM) | $5,998 | $7,740 | $7,972 | $7,044 | $6,911 | $7,507 |
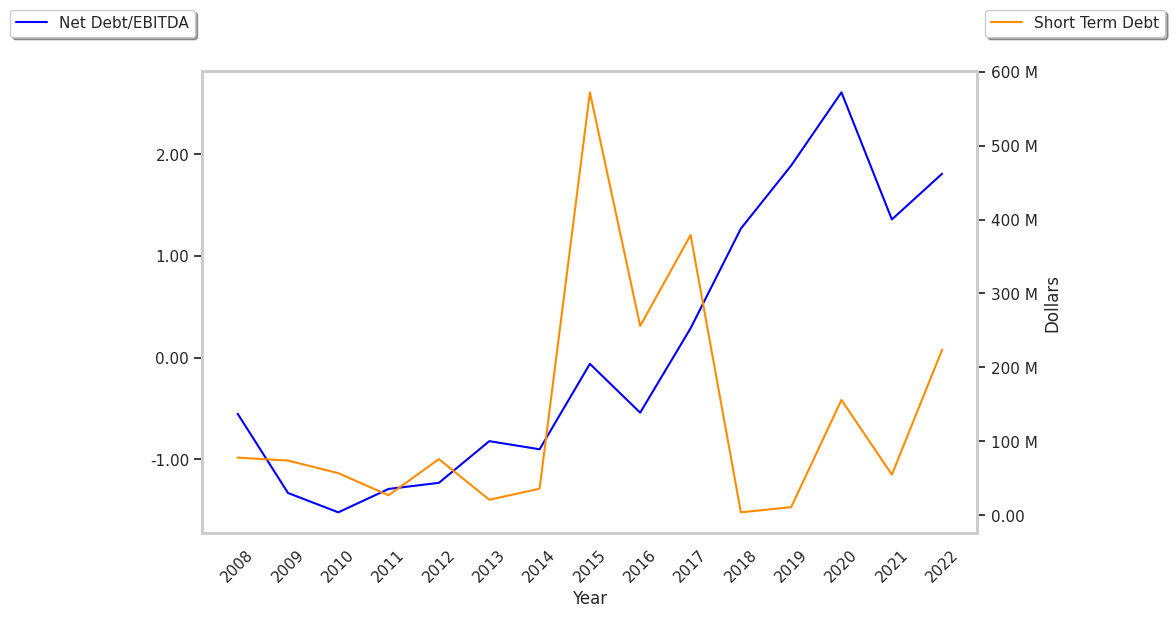
| Net Debt / EBITDA | 1.31 | 1.97 | 2.78 | 2.18 | 3.36 | 5.75 |
Corning has weak operating margins with a negative growth trend, declining EPS growth, and a highly leveraged balance sheet. On the other hand, the company benefits from growing revenues and decreasing reinvestment in the business and irregular cash flows.