We've been asking ourselves recently if the market has placed a fair valuation on Brown & Brown. Let's dive into some of the fundamental values of this large-cap Finance company to determine if there might be an opportunity here for value-minded investors.
The Market May Be Overvaluing Brown & Brown's Earnings and Assets:
Brown & Brown, Inc. markets and sells insurance products and services in the United States, Canada, Ireland, the United Kingdom, and internationally. The company belongs to the Finance sector, which has an average price to earnings (P/E) ratio of 12.38 and an average price to book (P/B) ratio of 1.58. In contrast, Brown & Brown has a trailing 12 month P/E ratio of 25.6 and a P/B ratio of 3.99.
Brown & Brown's PEG ratio is 2.13, which shows that the stock is probably overvalued in terms of its estimated growth. For reference, a PEG ratio near or below 1 is a potential signal that a company is undervalued.
Strong Revenue Growth With no capital expenditures:
| 2018 | 2019 | 2020 | 2021 | 2022 | 2023 | |
|---|---|---|---|---|---|---|
| Revenue (MM) | $2,014 | $2,392 | $2,613 | $3,051 | $3,573 | $4,132 |
| Revenue Growth | n/a | 18.76% | 9.25% | 16.76% | 17.11% | 15.64% |
| Interest Income (MM) | $41 | $64 | $59 | $65 | $141 | $188 |
| Operating Margins | 23% | 22% | 24% | 25% | 25% | 24% |
| Net Margins | 17% | 17% | 18% | 19% | 19% | 18% |
| Net Income (MM) | $344 | $399 | $480 | $587 | $672 | $747 |
| Depreciation & Amort. (MM) | $23 | $23 | $26 | $33 | $39 | $41 |
| Earnings Per Share | $1.25 | $1.45 | $1.74 | $2.12 | $2.41 | $2.66 |
| EPS Growth | n/a | 16.0% | 20.0% | 21.84% | 13.68% | 10.37% |
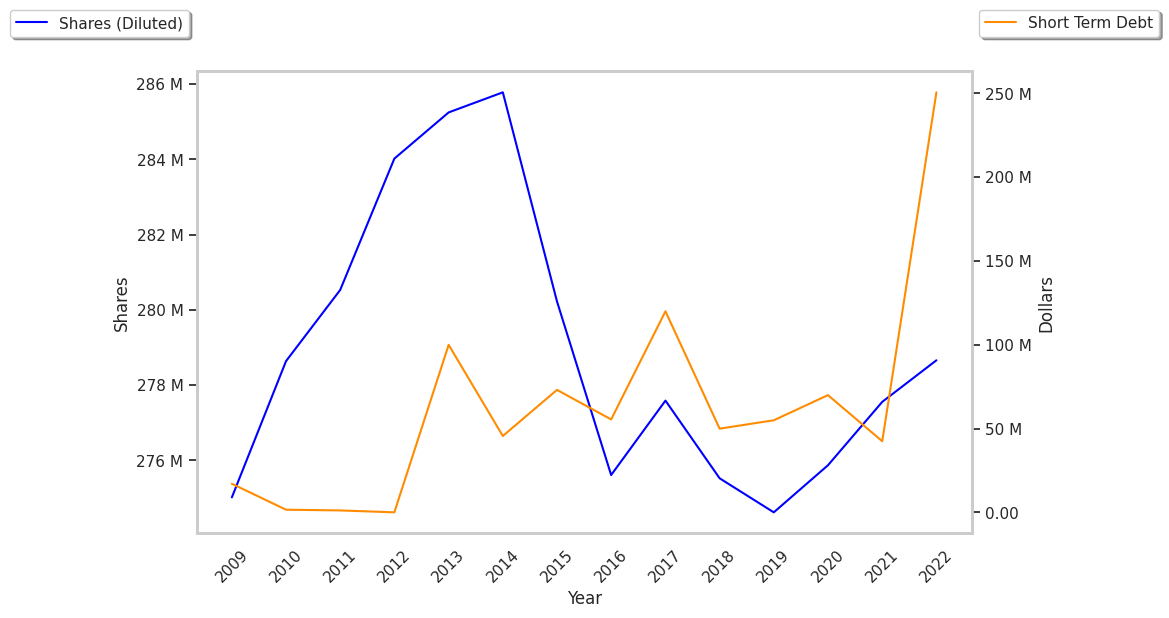
| Diluted Shares (MM) | 276 | 275 | 276 | 277 | 279 | 281 |
| Free Cash Flow (MM) | $526 | $605 | $642 | $764 | $829 | $927 |
| Capital Expenditures (MM) | $42 | $73 | $71 | $45 | $53 | $59 |
| Current Ratio | 1.22 | 1.22 | 1.26 | 1.25 | 1.09 | 1.06 |
| Total Debt (MM) | $1,557 | $1,610 | $2,166 | $2,065 | $4,193 | $3,707 |
| Net Debt / EBITDA | 2.3 | 1.94 | 2.32 | 1.72 | 3.87 | 2.87 |
Brown & Brown has a steady stream of strong cash slows, a strong EPS growth trend, and reasonable leverage levels. Furthermore, Brown & Brown has decent operating margins with a stable trend and just enough current assets to cover current liabilities.