Today we're going to take a closer look at large-cap Technology company General Electric Company, whose shares are currently trading at $134.26. We've been asking ourselves whether the company is under or over valued at today's prices... let's perform a brief value analysis to find out!
General Electric Company's Valuation Is in Line With Its Sector Averages:
General Electric Company operates as a high-tech industrial company in Europe, China, Asia, the Americas, the Middle East, and Africa. The company belongs to the Technology sector, which has an average price to earnings (P/E) ratio of 35.0 and an average price to book (P/B) ratio of 7.92. In contrast, General Electric Company has a trailing 12 month P/E ratio of 16.8 and a P/B ratio of 5.34.
When we divideGeneral Electric Company's P/E ratio by its expected five-year EPS growth rate, we obtain a PEG ratio of 0.86, which indicates that the market is undervaluing the company's projected growth (a PEG ratio of 1 indicates a fairly valued company). Your analysis of the stock shouldn't end here. Rather, a good PEG ratio should alert you that it may be worthwhile to take a closer look at the stock.
The Company's Revenues Are Declining:
| 2018 | 2019 | 2020 | 2021 | 2022 | 2023 | |
|---|---|---|---|---|---|---|
| Revenue (MM) | $97,012 | $90,221 | $58,025 | $56,469 | $58,100 | $65,359 |
| Revenue Growth | n/a | -7.0% | -35.69% | -2.68% | 2.89% | 12.49% |
| Operating Margins | -22% | 0% | -15% | -10% | -1% | 15% |
| Net Margins | -23% | -6% | 10% | -11% | 1% | 15% |
| Net Income (MM) | -$22,355 | -$4,979 | $5,704 | -$6,337 | $339 | $10,086 |
| Net Interest Expense (MM) | $2,321 | $2,479 | -$948 | $2,696 | $1,172 | $8,272 |
| Depreciation & Amort. (MM) | $2,163 | $2,018 | $1,895 | $1,622 | $1,338 | $1,531 |
| Earnings Per Share | -$20.58 | -$4.56 | $5.21 | -$5.77 | $0.31 | $9.18 |
| EPS Growth | n/a | 77.84% | 214.25% | -210.75% | 105.37% | 2861.29% |
| Diluted Shares (MM) | 1,086 | 1,091 | 1,094 | 1,098 | 1,096 | 1,099 |
| Free Cash Flow (MM) | -$1,649 | $6,518 | $2,088 | $2,474 | $4,855 | $5,436 |
| Capital Expenditures (MM) | $6,627 | $2,216 | $1,323 | $1,007 | $1,061 | $1,101 |
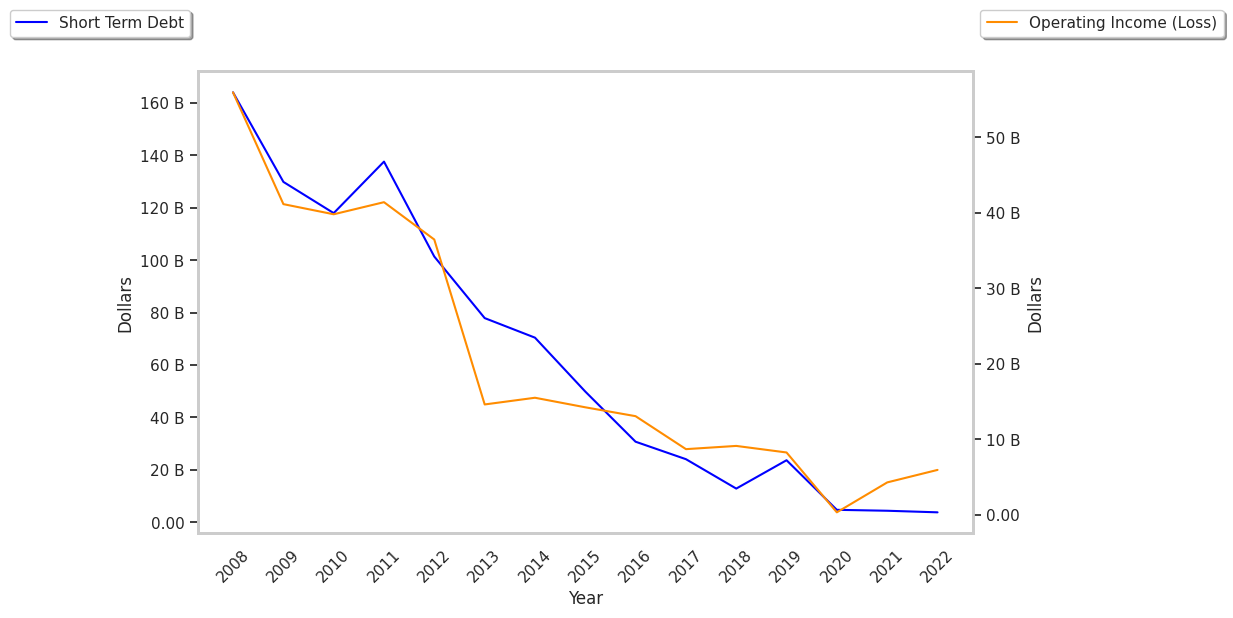
| Total Debt (MM) | $88,949 | $67,241 | $74,902 | $35,114 | $24,059 | $20,822 |
| Net Debt / EBITDA | -3.07 | 16.0 | -5.82 | -4.9 | 15.3 | 0.68 |
General Electric Company has generally positive cash flows, low leverage levels, and positive EPS growth. However, the firm has declining revenues and decreasing reinvestment in the business. Finally, we note that General Electric Company has weak operating margins with a positive growth rate and just enough current assets to cover current liabilities.