We've been asking ourselves recently if the market has placed a fair valuation on Stryker. Let's dive into some of the fundamental values of this large-cap Health Care company to determine if there might be an opportunity here for value-minded investors.
Stryker's Valuation Is in Line With Its Sector Averages:
Stryker Corporation operates as a medical technology company. The company belongs to the Health Care sector, which has an average price to earnings (P/E) ratio of 30.21 and an average price to book (P/B) ratio of 4.08. In contrast, Stryker has a trailing 12 month P/E ratio of 40.7 and a P/B ratio of 6.86.
Stryker's PEG ratio is 2.58, which shows that the stock is probably overvalued in terms of its estimated growth. For reference, a PEG ratio near or below 1 is a potential signal that a company is undervalued.
Strong Revenue Growth With a Flat Capital Expenditure Trend:
| 2018 | 2019 | 2020 | 2021 | 2022 | 2023 | |
|---|---|---|---|---|---|---|
| Revenue (MM) | $13,601 | $14,884 | $14,351 | $17,108 | $18,449 | $19,885 |
| Revenue Growth | n/a | 9.43% | -3.58% | 19.21% | 7.84% | 7.78% |
| Gross Margins | 66% | 65% | 63% | 64% | 63% | 63% |
| Operating Margins | 19% | 18% | 15% | 15% | 15% | 17% |
| Net Margins | 26% | 14% | 11% | 12% | 13% | 13% |
| Net Income (MM) | $3,553 | $2,083 | $1,599 | $1,994 | $2,358 | $2,585 |
| Net Interest Expense (MM) | -$181 | -$151 | -$269 | -$303 | -$158 | -$237 |
| Depreciation & Amort. (MM) | $306 | $314 | $340 | $371 | $371 | $387 |
| Earnings Per Share | $9.34 | $5.48 | $4.2 | $5.21 | $6.17 | $6.74 |
| EPS Growth | n/a | -41.33% | -23.36% | 24.05% | 18.43% | 9.24% |
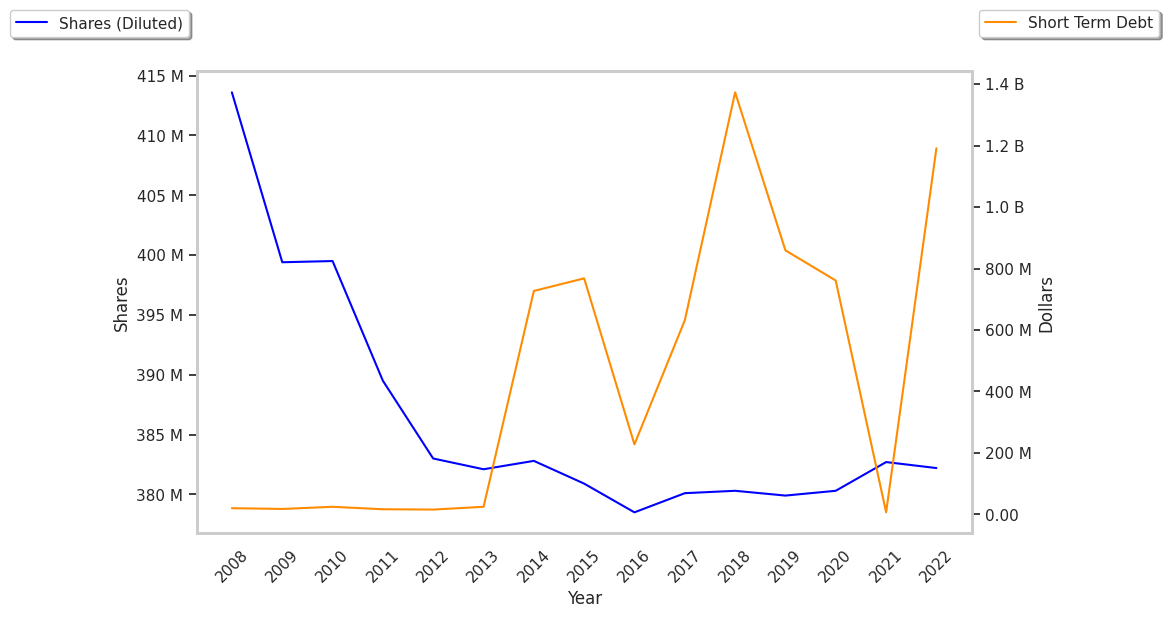
| Diluted Shares (MM) | 380 | 380 | 380 | 382 | 382 | 384 |
| Capital Expenditures (MM) | $572 | $649 | $487 | $525 | $588 | $618 |
| Current Ratio | 2.02 | 2.51 | 1.93 | 2.2 | 1.63 | 1.48 |
| Total Debt (MM) | $9,859 | $11,090 | $13,991 | $12,479 | $13,048 | $2,308 |
| Net Debt / EBITDA | 2.2 | 2.23 | 4.31 | 3.23 | 3.49 | 0.12 |
Stryker has rapidly growing revenues and a flat capital expenditure trend and wider gross margins than its peer group. Additionally, the company's financial statements display positive cash flows and healthy leverage levels. However, the firm has declining EPS growth. Finally, we note that Stryker has decent operating margins with a stable trend and just enough current assets to cover current liabilities.